
A to Z of Excel Functions: The FORECAST Function
19 August 2019
Welcome back to our regular A to Z of Excel Functions blog. Today we look at the FORECAST function.
A common approach to forecasting is known as simple linear regression. This is a technique where historical data is plotted on a chart and a “best straight line” is drawn through the data points to determine a linear relationship, viz.

The chart constructed usually is created as a scatter plot, with the independent variable (x) on the horizontal axis and the dependent variable (y) on the vertical axis. To be clear:
- the independent variable (x) is one you either have control of or else may select
- the dependent variable (y) is the result of that control or choice, sometimes referred to as y = f(x).
For example, if you are trying to forecast sales, x would be the period (e.g. months) and y would be the forecast / actual amount of sales (e.g. dollar amount).
Not all relationships are linear, but a surprising number may be determined by plotting log x against log y (it does not matter what base is used for the logarithms as long as the same one is chosen). Using this technique to forecast the relationship is known as simple linear regression, which is formally described as a linear approach to modelling the relationship between a scalar response (or dependent variable) and one explanatory variable (or independent variable).
The technique most commonly used to find the “best straight line” is the ordinary least squares (OLS) method, where geometrically, the sum of the squared distances between the line and the observed data parallel to the y-axis is minimised.
The FORECAST function calculates, or predicts, a future value by using existing values. The predicted value is a y-value for a given x-value. The known values are existing x-values and y-values, and the new value is predicted by using linear regression.
In Excel 2016, this function has been replaced with FORECAST.LINEAR as part of the new set of forecasting functions. It's still available for backward compatibility, but consider using the new function from Excel 2016 / Office 365 onwards.
The FORECAST function employs the following syntax to operate:
FORECAST(x, known_y's, known_x's)
The FORECAST function has the following arguments:
- x: this is required and represents the data point for which you wish to predict a value
- known_y’s: this is required. This is the dependent range of data
- known_x’s: this is also required. This denotes the independent range of data.
It should be further noted that:
- if x is non-numeric, FORECAST returns the #VALUE! error value
- if known_y's and known_x's are empty or contain a different number of data points, FORECAST returns the #N/A error value
- if the variance of known_x's equals zero, then FORECAST returns the #DIV/0! error value
- the equation for FORECAST is a + bx, where:

and
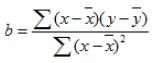
and where x bar and y bar are the sample means AVERAGE(known_x's) and AVERAGE(known y's).
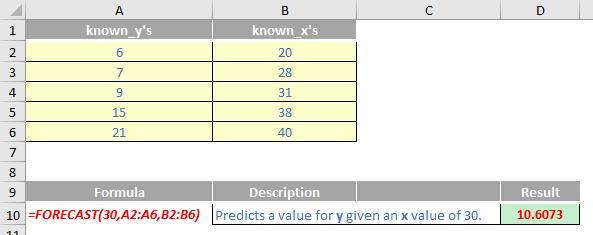
Please see my example below:
We’ll continue our A to Z of Excel Functions soon. Keep checking back – there’s a new blog post every other business day.