
A to Z of Excel Functions: The F.DIST Function
11 March 2019
Welcome back to our regular A to Z of Excel Functions blog. Today we look at the F.DIST function.
The F.DIST function
Named after Sir Ronald Aylmer Fisher, a British statistician, geneticist and mega-geanius, the F-distribution is defined as a continuous distribution obtained from the ratio of two chi-square distributions and used in particular to test the equality of the variances of two normally distributed variances a continuous probability distribution, which means that it is defined for an infinite number of different values. This analysis of variance is often referred to as “ANOVA”, which I thought was a cheap car.
I’m glad we have cleared that up then, eh? F.DIST for an explanation..?
To be “slightly” clearer, the F-distribution can be used for several types of applications, including testing hypotheses about the equality of two population variances and testing the validity of what is known as a multiple regression equation, i.e. a formulaic attempt to model the relationship between two or more explanatory variables and a response variable by fitting a linear equation to observed data.
The F-distribution shares one important property with the Student’s t-distribution: probabilities are determined by a concept known as degrees of freedom. Unlike the Student’s t-distribution, the F-distribution is characterized by two different types of degrees of freedom: numerator and denominator degrees of freedom.
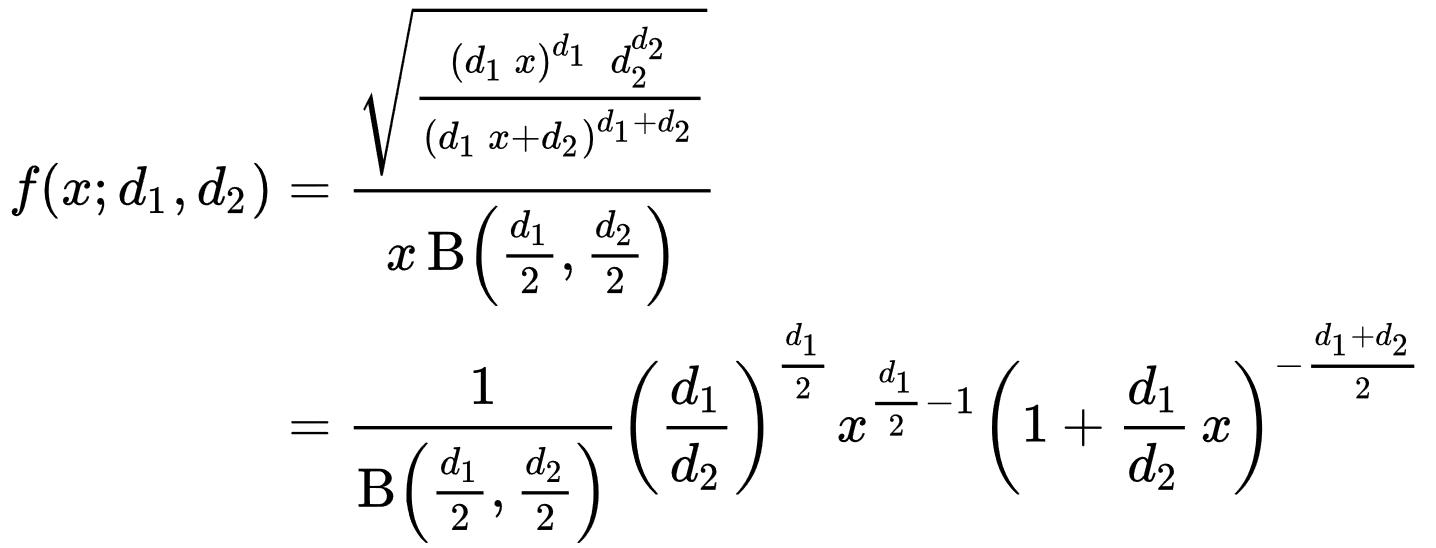
The formula for the probability density function is given by
The cumulative distribution function is given by
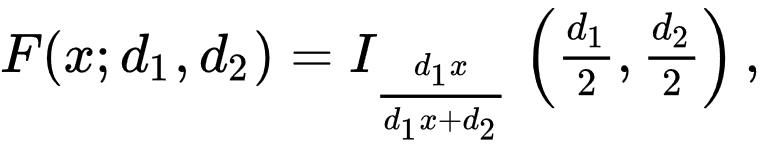
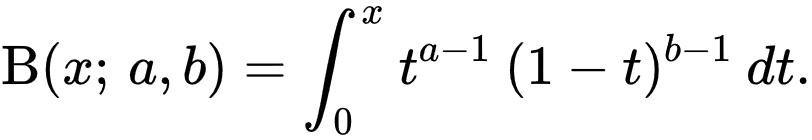
Where I is the regularized incomplete beta function:
In other words, use the F.DIST function in Excel when you need to and try not to ask too many questions.
The F-distribution has two important properties:
- It’s defined only for positive values.
- It’s not symmetrical about its mean; instead, it’s positively skewed.
A distribution is positively skewed if the mean is greater than the median (the mean is the average value of a distribution, and the median is the midpoint; half of the values in the distribution are below the median and half are above). This function returns the F probability distribution. You can use this function to determine whether two data sets have different degrees of diversity.
A good example of a positively skewed distribution is household incomes. Suppose that half of the households in a country have incomes below $50,000 and half have incomes above $50,000; this indicates that the median household income is $50,000. Among households with incomes below $50,000, the smallest possible value is $0. Among households with incomes above $50,000, there may be incomes of several million dollars per year. This imbalance between incomes below the median and above the median causes the mean to be substantially higher than the median. Suppose for example that the mean income in this case is $120,000. This shows that the distribution of household incomes is positively skewed.

This image (above) shows a graph of the F-distribution for different combinations of numerator and denominator degrees of freedom. In each case, numerator degrees of freedom are listed first, and denominator degrees of freedom are listed second. The level of significance in each case is 0.05.
A level of significance is used to test a hypothesis. An hypothesis test begins with a null hypothesis; this is a statement that’s assumed to be true unless there is strong contrary evidence. There is also an alternative hypothesis; this is a statement that is accepted in place of the null hypothesis if there’s sufficient evidence to reject the null hypothesis.
The level of significance, designated alpha, refers to the probability of incorrectly rejecting the null hypothesis when it is actually true. This is known as a Type I error. By contrast, a Type II error occurs when you fail to reject the null hypothesis when it’s actually false. Therefore, with a level of significance of 0.05, there is a 5 percent chance of committing a Type I error.
The figure shows that the distribution isn’t defined for negative values (as you can see, no negative values appear along the horizontal axis). Additionally, as the number of degrees of freedom increases, the shape of the distribution shifts to the right. The distribution has a long right tail (more formally, it’s skewed to the right, or positively skewed).
Important: This (right-tailed) F.DIST function enhances an older function so that it may provide improved accuracy and whose names better reflect their usage. Although the previous function is still available for backward compatibility, you should consider using this newer function from now on, because the older variant may not be available in future versions of Excel, according to Microsoft. However, this is NOT the equivalent of FDIST. Interestingly, it is F.DIST.RT which supersedes FDIST.
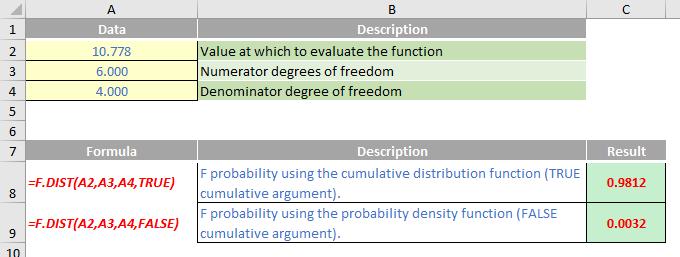
The F.DIST function employs the following syntax to operate:
F.DIST(x,deg_freedom1,deg_freedom2,cumulative)
The F.DIST function has the following arguments:
- x: this is required and represents the value at which to evaluate the function
- deg_freedom1: this is also required and denotes the numerator degrees of freedom
- deg_freedom2: this is again required and represents the denominator degrees of freedom
- cumulative: again, required. This is a logical value that indicates which form of the function to use. If cumulative is TRUE, F.DIST returns the cumulative distribution function; if FALSE, it returns the probability density function.
It should be further noted that:
- if any argument is non-numeric, F.DIST returns the #VALUE! error value
- if x < 0, F.DIST returns the #NUM! error value
- if deg_freedom1 or deg_freedom2 is not an integer, it is truncated
- If either deg_freedom1 or deg_freedom2 is strictly less than 1, F.DIST returns the #NUM! error value.
Please see my example below:
We’ll continue our A to Z of Excel Functions soon. Keep checking back – there’s a new blog post every business day.
A full page of the function articles can be found here.