
A to Z of Excel Functions: The COVAR Function
9 February 2018
Welcome back to our regular A to Z of Excel Functions blog. Today we look at the COVAR function.
The COVAR function
So what’s the COVAR story here? Well, this is all about the measure of the linear relationship between random variables. In probability theory and statistics, covariance is a measure of the joint variability of two random variables. If the greater values of one variable mainly correspond with the greater values of the other variable, and the same holds for the lesser values, i.e. the variables tend to show similar behaviour, the covariance is positive. In the opposite case, when the greater values of one variable mainly correspond to the lesser values of the other, i.e. the variables tend to show opposite behaviour, the covariance is negative.
The sign of the covariance therefore shows the tendency in the linear relationship between the variables. The magnitude of the covariance is not easy to interpret because it is not normalised and hence depends on the magnitudes of the variables. The normalised version of the covariance, known as the correlation coefficient, however, shows by its magnitude the strength of the linear relationship.
This function returns covariance, the average of the products of deviations for each data point pair in two data sets. It is used to determine the relationship between two data sets. For example, you can examine whether greater income accompanies greater levels of education.
The COVAR function employs the following syntax to operate:
COVAR(array1, array2)
The COVAR function has the following arguments:
- array1: this is required and represents the first cell range of integers
- array2: this is also required. This is the second cell range of integers.
It should be further noted that:
- this function has been replaced with two newer functions (COVARIANCE.P and COVARIANCE.S) that may provide improved accuracy and whose names better reflect their usage. Although this function is still available for backward compatibility, you should consider using the new functions going forward, since this function may not be available in future versions of Excel
- the arguments must either be numbers or be names, arrays, or references that contain numbers
- if an array or reference argument contains text, logical values, or empty cells, those values are ignored; however, cells with the value zero are included
- if array1 and array2 have a different number of data points, COVAR returns the #N/A error value
- if either array1 or array2 is empty, COVAR returns the #DIV/0! error value
- the covariance is given by the formula:
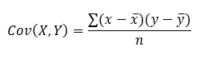
where

are the sample means AVERAGE(array1) and AVERAGE(array2), and n is the sample size.
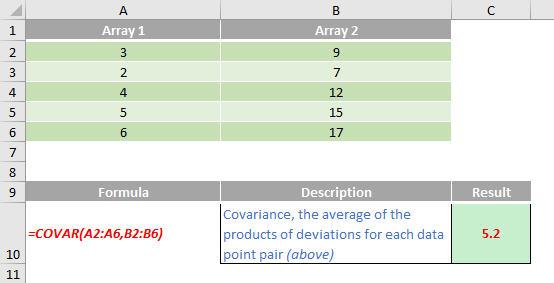
Please see my example below:
We’ll continue our A to Z of Excel Functions soon. Keep checking back – there’s a new blog post every business day.
A full page of the function articles can be found here.