Power BI Desktop November 2017 Update
19 November 2017
November’s update saw conditional formatting getting a major update, with the ability to control the color based on rules. Further, if you have a slow data source, there are now report options that help restrict the number of queries that are sent to the source. Finally, there’s also several formatting features added, including cell alignment for table and matrix and precise control over the order of overlapping charts on your report.
In summary, the list of updates are as follows:
Reporting
- Rule-based conditional formatting for table and matrix
- Cell alignment for table and matrix
- Control visual ordering through the selection pane
- Lock objects on your report
- Esri Plus Subscription available for ArcGIS Maps for Power BI
- Report options for slow data sources
- Filtering performance improvements
- Recently released custom visuals:
o Image Timeline
o Social network graph
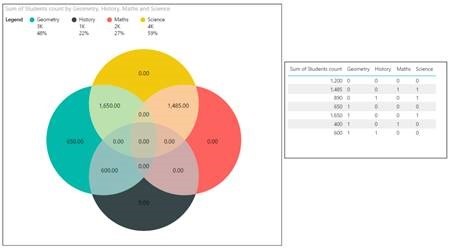
o Venn diagram by MAQ Software
o HTML viewer
Analytics
- Cell-level formatting for multidimensional AS models for multi-row card
Data connectivity
- Impala connector – support for Windows Authentication
Query editing
- Add Column From Examples improvements.
We'll be summarising these in our next newsletter (December). We even have training in Power BI which you can find out more about here. If you are not already a subscriber, why not sign up at the bottom of any SumProduct web page? And don't forget to download the latest version of Power BI Desktop here too.