November 2018 Updates for Power BI Desktop
15 November 2018
Perhaps a few less updates than in recent months, but that’s to be expected and there’s still enough to keep you on your toes! Here’s the full run down of the November updates:
Reporting
- Expand and collapse matrix row headers
- Copy and paste between Power BI Desktop files
- Updated filtering experience (Preview)
- Report accessibility improvements
Analytics
- Colour saturation on visuals upgraded to use conditional formatting
- Follow-up questions in the Q&A explorer
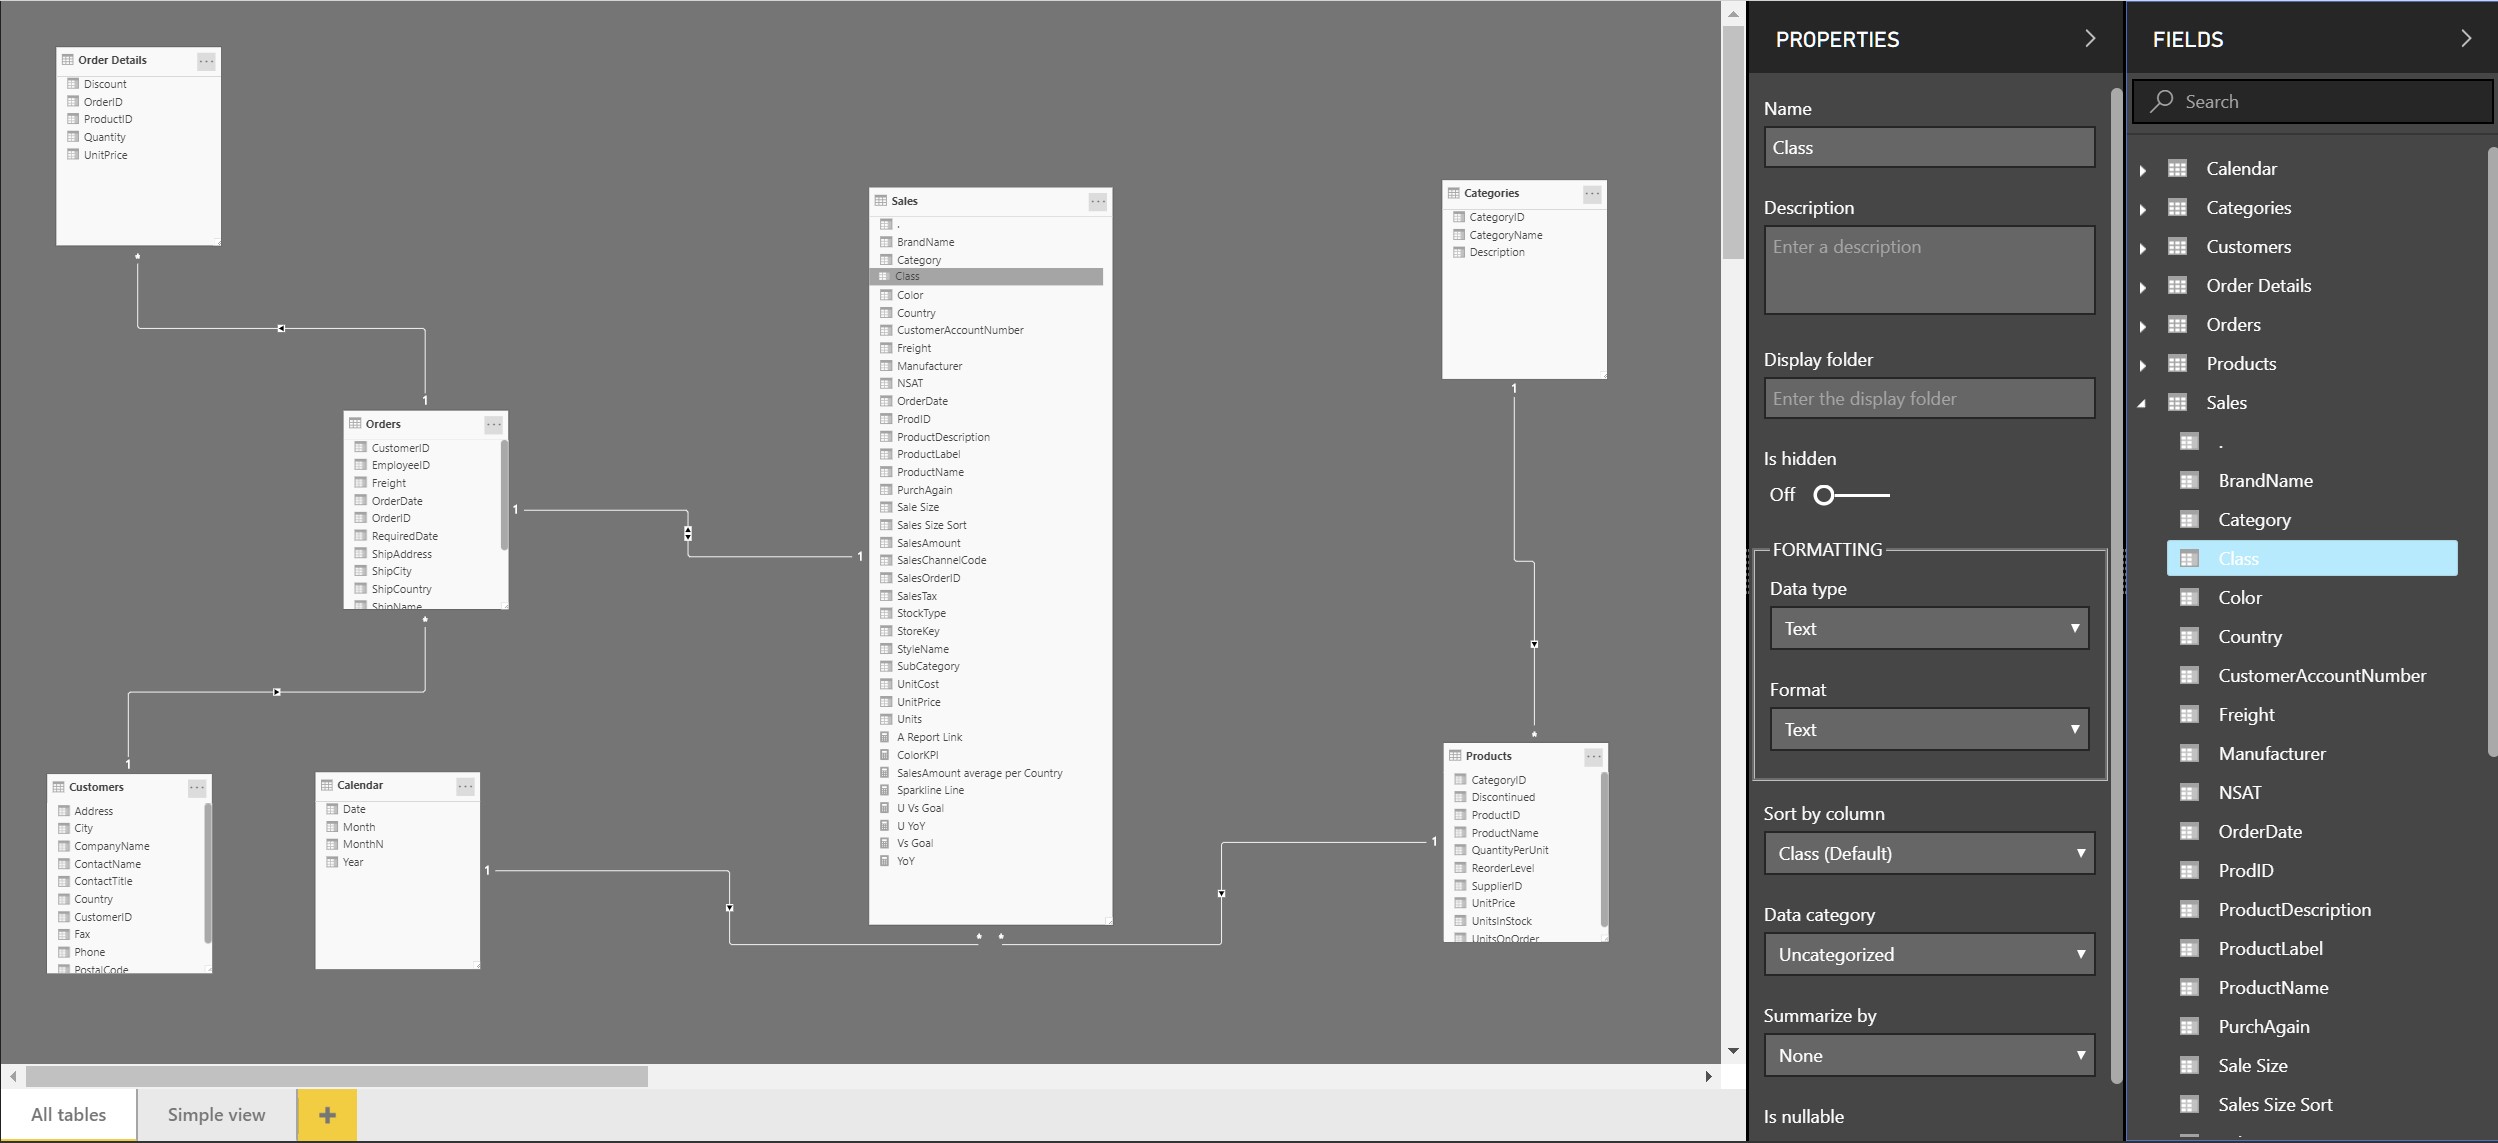
Modelling
- New modelling view (Preview)
- Composite models now Generally Available
- Modeling accessibility improvements
- New DAX functions
Custom Visuals
- Calendar by MAQ Software
- Ratings by MAQ Software
- Hourglass Chart by MAQ Software
- Forecast Using Multiple Models by MAQ Software
- Pie Charts Tree
Data Connectivity
- Azure DevOps Server connector
- PDF Connector support for Start Page and End Page parameters
- Improved Azure Consumption Insights connector.
As always, we'll be detailing these updates in our next (December) newsletter. Please remember we have training in Power BI which you can find out more about here. If you are not already a subscriber, why not sign up at the bottom of any SumProduct web page? And don't forget to download the latest version of Power BI Desktop here too.