Please note javascript is required for full website functionality.

Blog

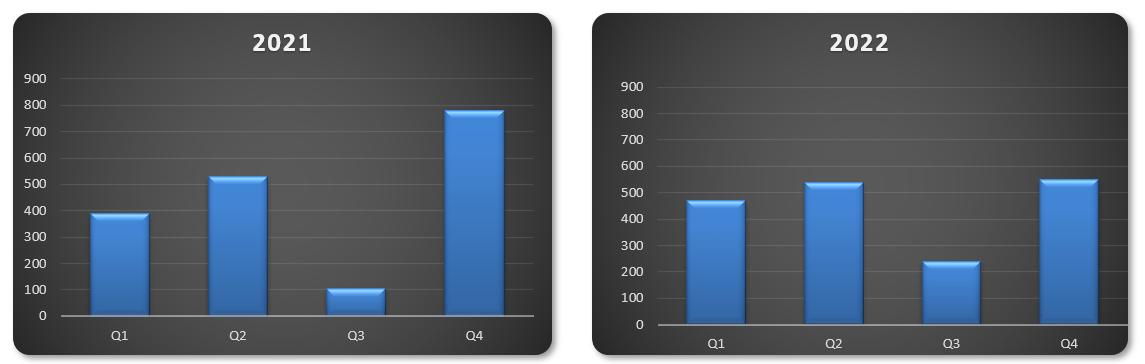
Charts and Dashboards: Tornado Charts - Part 1

22 April 2022

Welcome back to our Charts and Dashboards blog series. This week, we consider tornado charts and their uses.


Power BI Blog: Power BI Goals – Custom Statuses and Team Notifications

21 April 2022

Power BI Goals continues to move forward. This time, we check out the new custom statuses and Teams notifications.


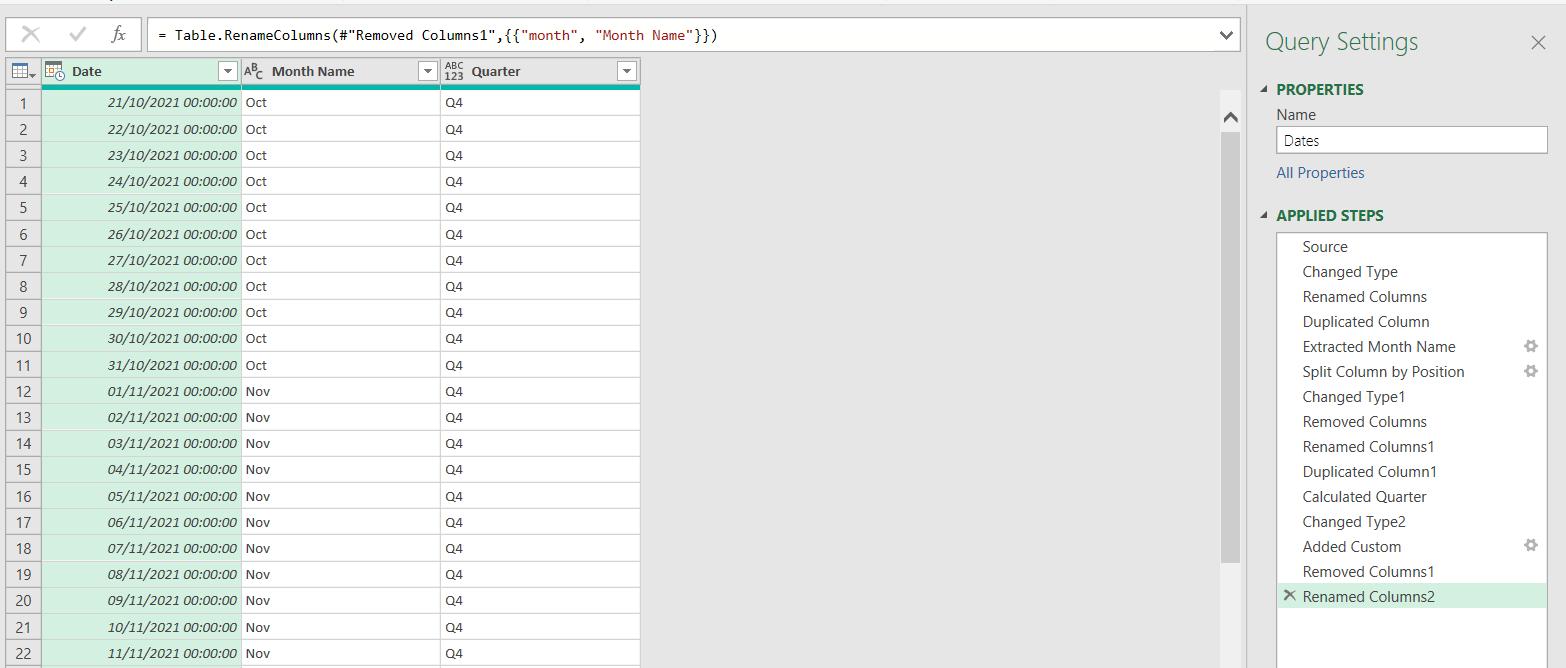
Power Query: More Haste Less Steps Part 1

20 April 2022

Welcome to our Power Query blog. This week, I look a query with too many steps.


Power Pivot Principles: The A to Z of DAX Functions – BITRSHIFT

19 April 2022

In our long-established Power Pivot Principles articles, we continue our series on the A to Z of Data Analysis eXpression (DAX) functions. This week, we look at BITRSHIFT.


A to Z of Excel Functions: The EXPAND Function

18 April 2022

Welcome back to our regular A to Z of Excel Functions blog. Today we look at the EXPAND function.


Charts and Dashboards: Creating Comparable Charts - Part 2

15 April 2022

Welcome back to our Charts and Dashboards blog series. This week, we finalise our charts from last week by creating similarly-scaled axes.


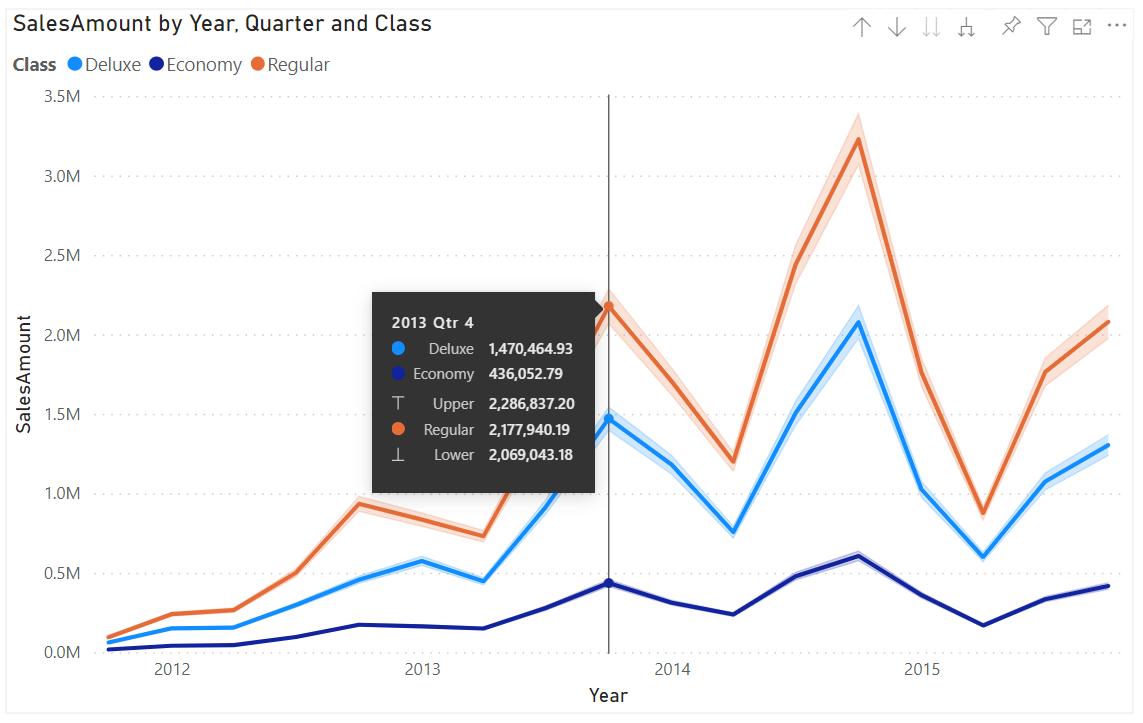
Power BI Blog: Error Bars in Preview

14 April 2022

You may now add error bars to your line charts to visualise the uncertainty in your data.


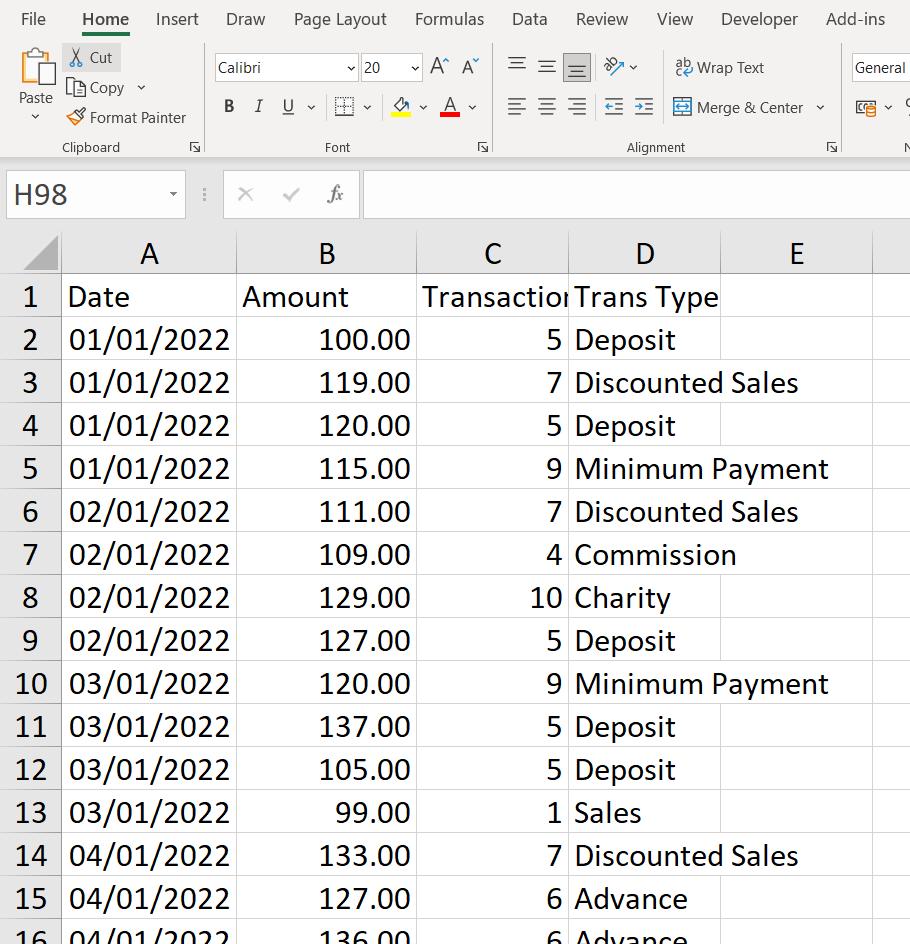
Power Query: Sheets Ahead Part 2

13 April 2022

Welcome to our Power Query blog. This week, I continue uploading data from multiple sheets.


Power Pivot Principles: The A to Z of DAX Functions – BITOR

12 April 2022

In our long-established Power Pivot Principles articles, we continue our series on the A to Z of Data Analysis eXpression (DAX) functions. This week, we look at BITOR.


A to Z of Excel Functions: The DROP Function

11 April 2022

Welcome back to our regular A to Z of Excel Functions blog. Today we look at the DROP function.


Newsletter