Please note javascript is required for full website functionality.

Blog

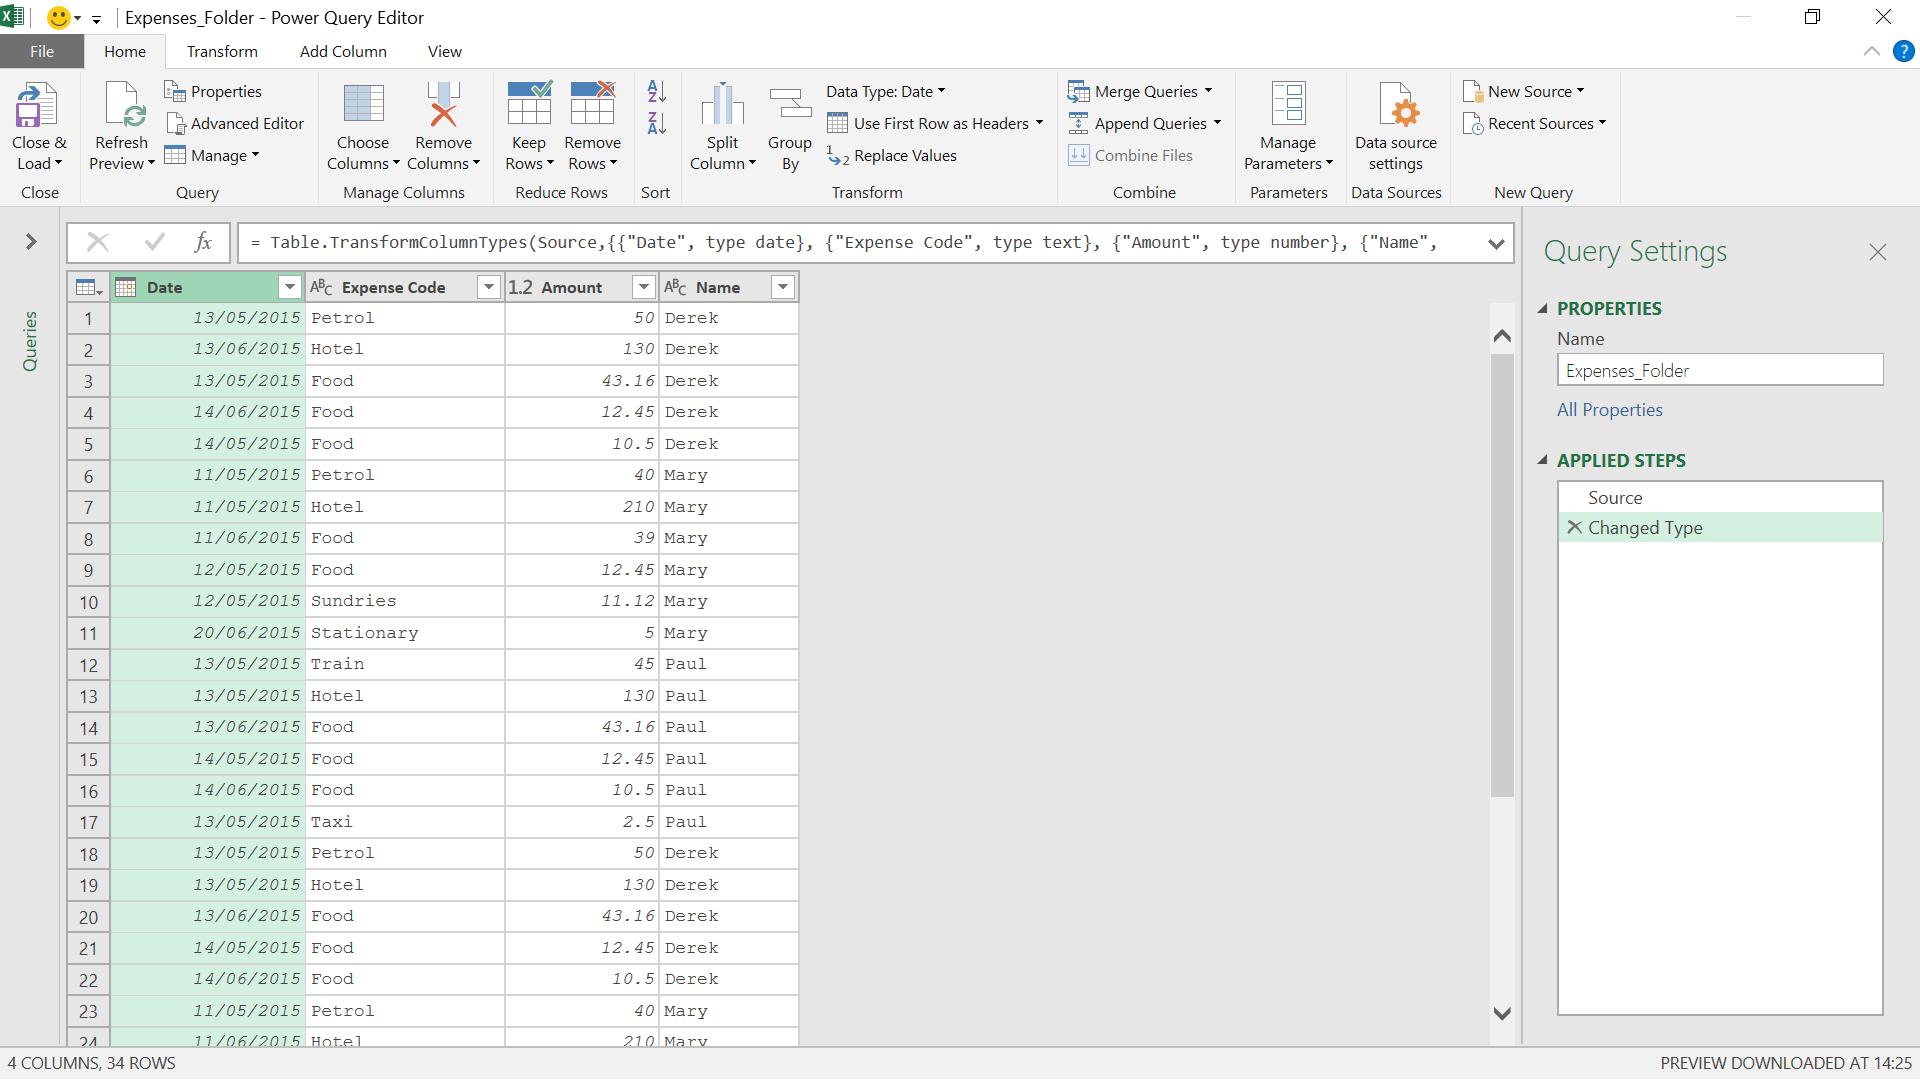
Power Query: Functional Query

3 April 2019

Welcome to our Power Query blog. This week, I look at how to make a query more functional.


Power Pivot Principles: Conditional Custom Columns Using IF, AND, and ‘&&’

2 April 2019

Welcome back to our Power Pivot blog. Today, we discuss how to create conditional custom columns with multiple criteria.


Challenges: Monday Morning Mulling: March 2019 Challenge

1 April 2019

On the final Friday of each month, we set an Excel problem for you to puzzle over for the weekend. On the Monday, we publish a solution. If you think there is an alternative answer, feel free to email us. We’ll feel free to ignore you.


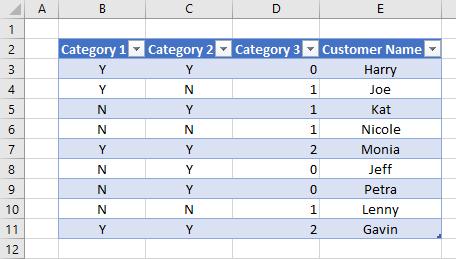
Challenges: Final Friday Fix: March 2019 Challenge

29 March 2019

On the final Friday of each month, we’re going to set an Excel challenge for you to puzzle over so that you can get your “Excel fix”. Challenge your office colleagues to see who can solve the puzzle quickest. There’s no prizes at this stage, you’re playing for bragging rights only!


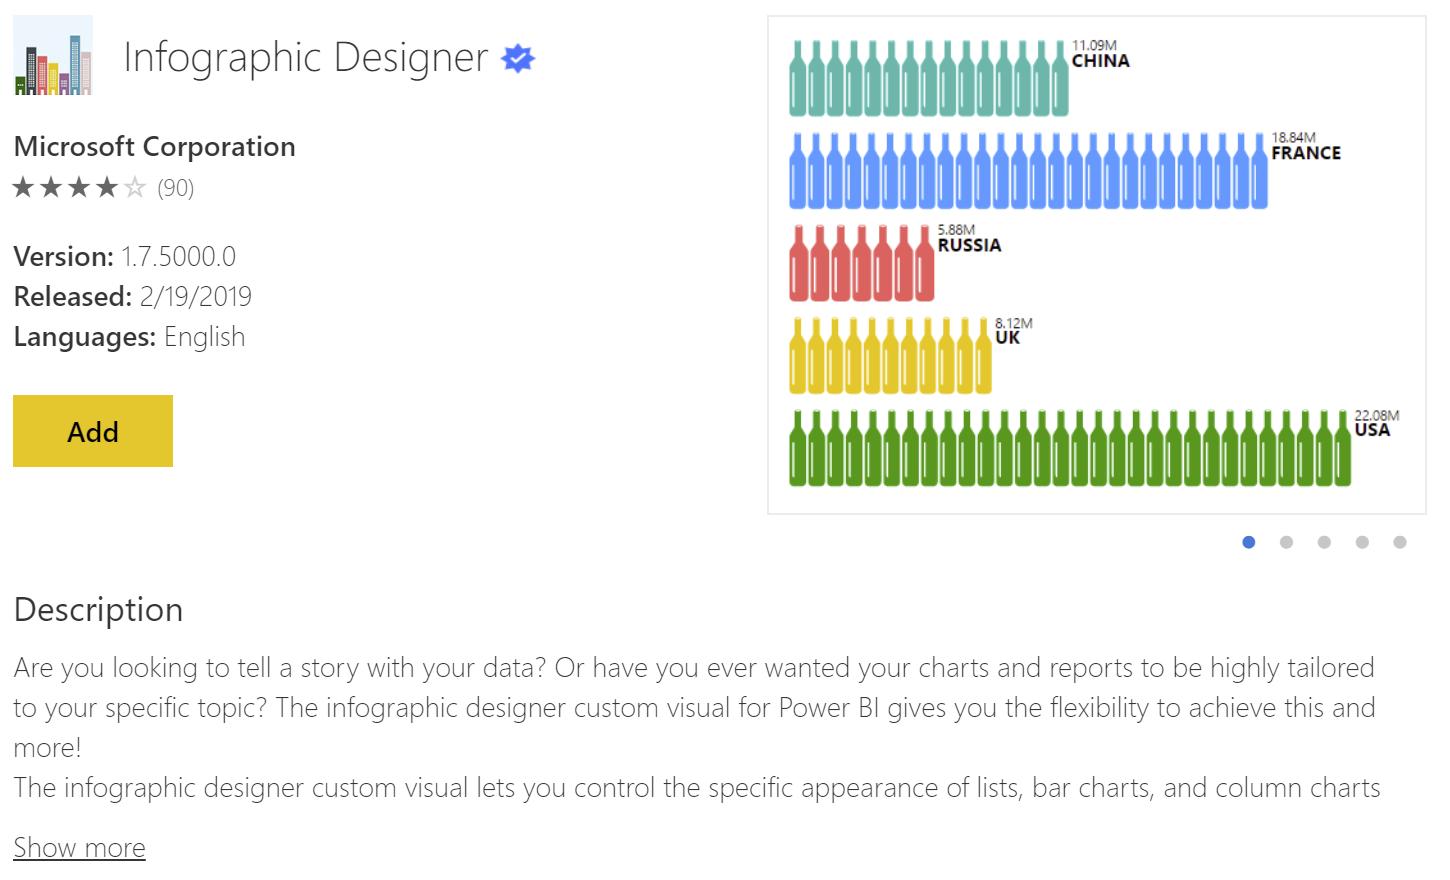
Power BI Blog: Custom Visuals – Infographic Designer

28 March 2019

Welcome back to the Power BI blog series! This week we are going to take a look at the Infographic Designer, typically one of the featured custom visuals on the marketplace.


Power Query: Types of Value

27 March 2019

Welcome to our Power Query blog. This week, I introduce more Value() M functions; Value.Type() and Value.ReplaceType().


Power Pivot Principles: How to Create the CAGR Measure, Part 3

26 March 2019

Welcome back to our Power Pivot blog. We continue on our CAGR series. Today, we shall look into making our CAGR measure more dynamic and discuss additional improvements to the measures.


A to Z of Excel Functions: The F.INV Function

25 March 2019

Welcome back to our regular A to Z of Excel Functions blog. Today we look at the F.INV function.


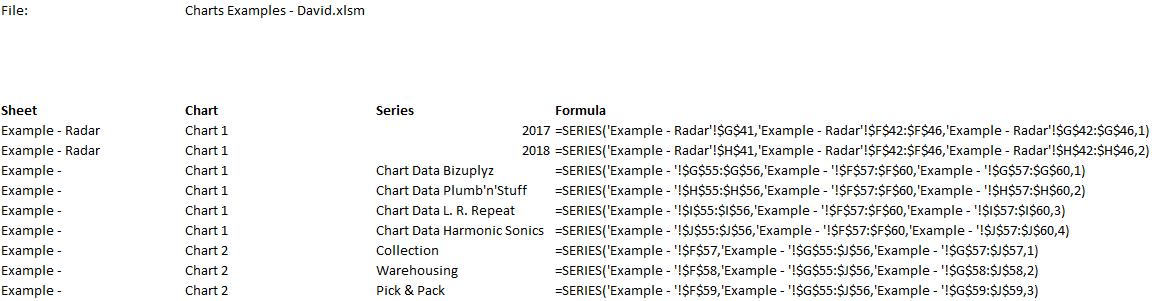
VBA Blogs: Charts and Macros 4

22 March 2019

Welcome back to this week’s VBA blog! This month, we have been looking at the interaction between charts and macros.


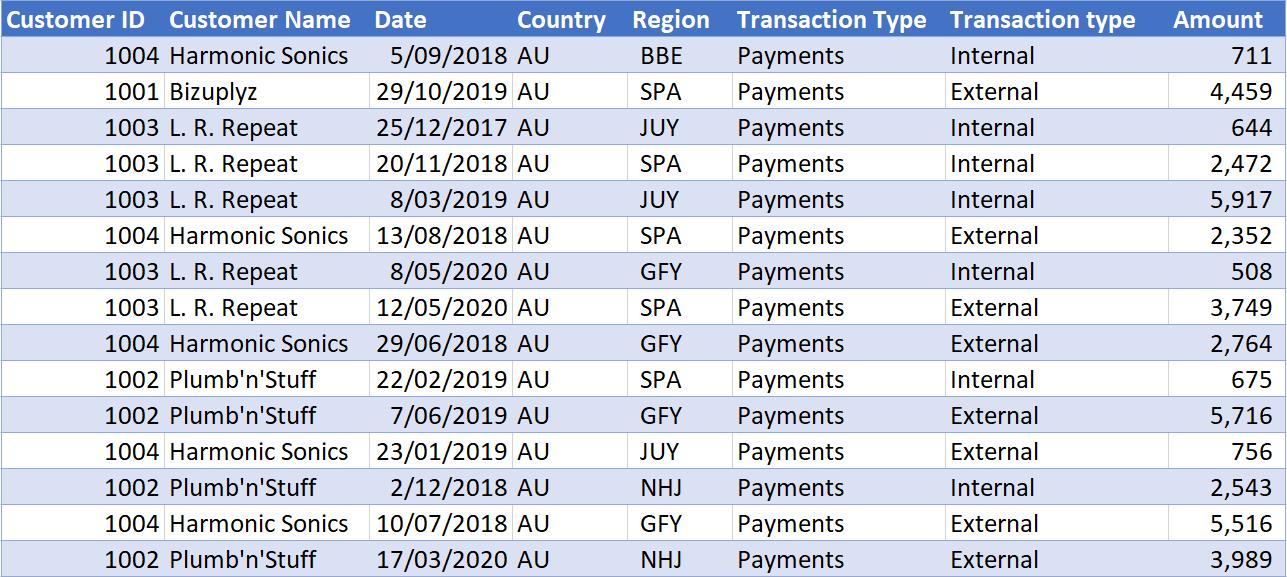
Power BI Blog: Custom Visuals – Summary Table

21 March 2019

Welcome back to the Power BI blog series. This week, we’re going to look at tables that you can customised to your needs, where you can arrange rows, add custom formulas, for example Profit and Loss statement (P&L) that we’ll particularly create in this post.


Newsletter