
Let’s Be Frank: Incensed by MIRR..?
In this article we return once more to the Modified Internal Rate of Return and respond to one of the most common queries received. By Liam Bastick, Director with SumProduct Pty Ltd.
Query
Further to your previous articles on Internal Rate of Return (IRR) and Modified Internal Rate of Return (MIRR), I recognise that MIRR may be a more appropriate measure of an investment’s attractiveness. However, the Excel function MIRR(Cashflows,Annual_Finance_Rate,Annual_Reinvestment_Rate) only works where periods are of equal length. How can I calculate the MIRR for cashflows relating to unequal period lengths?
Advice
If I had a dollar for every time this question was asked I might have some money in my wallet.
I think I could write a book on the problems with calculating IRRs in Excel and how MIRR might be a more valid approach (see Irreverent IRR and Many Happy Returns: Modified Internal Rate of Return (MIRR)). I am unsure whether anyone would read it though.
If you are not familiar with these issues, I would strongly recommend you read the aforementioned articles before continuing.
To summarise, IRR is problematic for several reasons:
- There can be more than one discount rate which makes the Net Present Values of the underlying cash flows equal to zero;
- IRR assumes a symmetry implicit between the reinvestment rate (i.e. the return surplus cash flows may accrue on deposit) and the interest rate (i.e. the rate charged for sums borrowed). This assumption only holds true in Cloud Cuckoo Land; and
- Excel’s functions IRR and XIRR can be limited; the former only works for cashflows reported in periods of equal length, whereas the latter will not always calculate correctly given the logic of the underlying algorithm. Goal Seek may often be a better approach to confirm IRRs in a spreadsheet.
The Modified Internal Rate of Return (MIRR) is defined as follows:
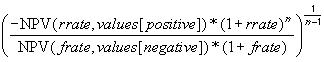
where:
- NPV() is the Excel NPV function
- rrate is the reinvestment rate
- frate is the finance rate
- values[positive] is the positive values in the array only
- values[negative] is the negative values in the array only
- n is the number of periods
This formula will always give the same value regardless of the number of changes of sign in the cash flow. It also takes into account the disparity between reinvestment and finance rates.
The attached Excel file walks through how MIRR works (essentially all negative sums are discounted to the start of the project at the finance rate, whilst all surplus cash flows are compounded to the final period, gaining interest at the reinvestment rate).
Excel has a function that will compute the MIRR for cashflows occurring in periods of equal length:
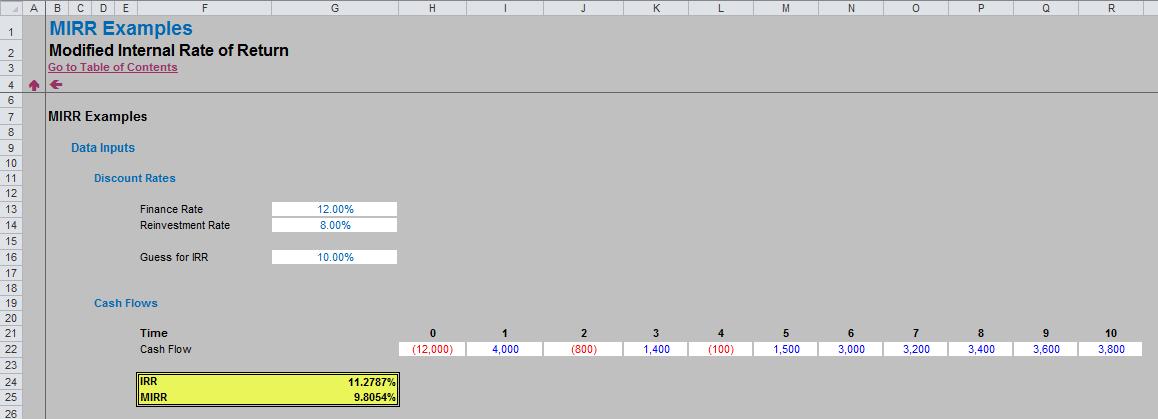
Using the formula, MIRR is arguably quicker to calculate than IRR, more objective (only one solution) and takes into account the differing rates implicit in the cash flows. The MIRR is usually lower than the IRR (as in our example above, assuming the reinvestment rate will typically be lower than the finance rate).
The MIRR is often seen as a financial measure of an investment’s attractiveness. It is used frequently in capital budgeting to rank alternative investments of similar size (although this may not always be an appropriate approach: NPV or NPV per $ invested [the so-called “bang for buck” key factor analysis] may be more suitable metrics).
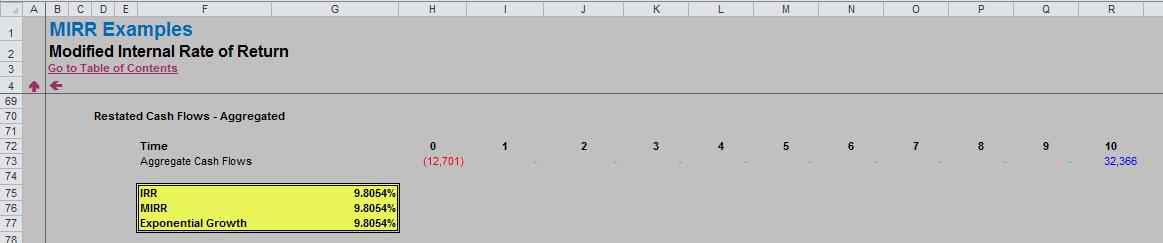
If negative cashflows are rolled up to the first period and positive flows are carried forward / reinvested to the final period (as explained above), IRR and MIRR will equate:
Reverting to our reader’s question, how do you do this when the cashflow periods are not of equal duration?
The answer is surprisingly simple if the roll-back / roll-forward technique used in the Excel file is employed:
- Cash outflows are discounted back to the first (minimum) date, discounted on a daily basis using the finance / interest rate;and
- Cash inflows are reinvested to the final (maximum) date, compounded on a daily basis using the reinvestment rate.

In this example (replicated in the attached Excel file), all periods are of equal duration (365 days) so that the MIRR may be reconciled to the original periodic example (first illustration).
However, once you are satisfied these techniques work as intended, dates can quickly be modified, e.g.

If XNPV calculates NPVs on an aperiodic basis and XIRR calculates IRRs on an aperiodic basis, then it seems reasonable to call this XMIRR!
In fact, in these last two illustrations four approaches have been compared:
1. XIRR: uses a methodology similar to the IRR approach of Irreverent IRR using the aggregated cash flows. With only two cashflows and only one change of sign, only one IRR is possible.
2. Compound Approach: Using an Excel function is not necessary if the aggregated cash flows have been computed. From the two cash flows, dividing the aggregated inflows by the positive value of the aggregated outflows gives the growth over the period of time. By using a simple compounding formula, this can be readily converted to an equivalent annual rate (i.e. the MIRR).
3. Array Approach: This is a variant often found on the web. An array function is used (see Array of Light for more information). This formula simply uses the original cashflows and performs all computations in one go:
{=POWER((SUM(IF(Values>0,Values*(POWER(1+Annual_Reinvestment_Rate,(MAX(Dates)-Dates)/Days_in_Year)),0)))/(SUM(IF(Values<0,Values/(POWER(1+Annual_Finance_Rate,(Dates-MIN(Dates))/Days_in_Year)),0)))*-1,Days_in_Year/(MAX(Dates)-MIN(Dates)))-1}
4. User Defined Function: Thanks to David Hager for this one – here a Function has been built using VBA code that again only requires the initial cashflows and dates (macros must be enabled for this to work):

The attached Excel file contains this code in the VBA module.
Personally, I would use the second approach. I think it makes sense to step out the computation so that others may follow the logic and it leads to by far the simplest formula.
Word to the Wise
Do remember that if your objective is to maximise shareholder value then Net Present Value computations should be undertaken ahead of MIRR calculations. If an investment utilises a scarce resource, then perhaps key factor analysis (i.e. NPV divided by the scarce resource) may be a more appropriate decision tool.
Where MIRR computations are required for aperiodic durations, eagle-eyed readers may have spotted that the attached Excel file assumes there are always 365 days in a year, which is not the case in reality. Before people try to build computations to allow for this additional complexity, do bear in mind the likely accuracy of your cashflow forecasts!