
Power Query: Hot Cross Joins
25 April 2018
Welcome to our Power Query blog. This week I look at cross joins.
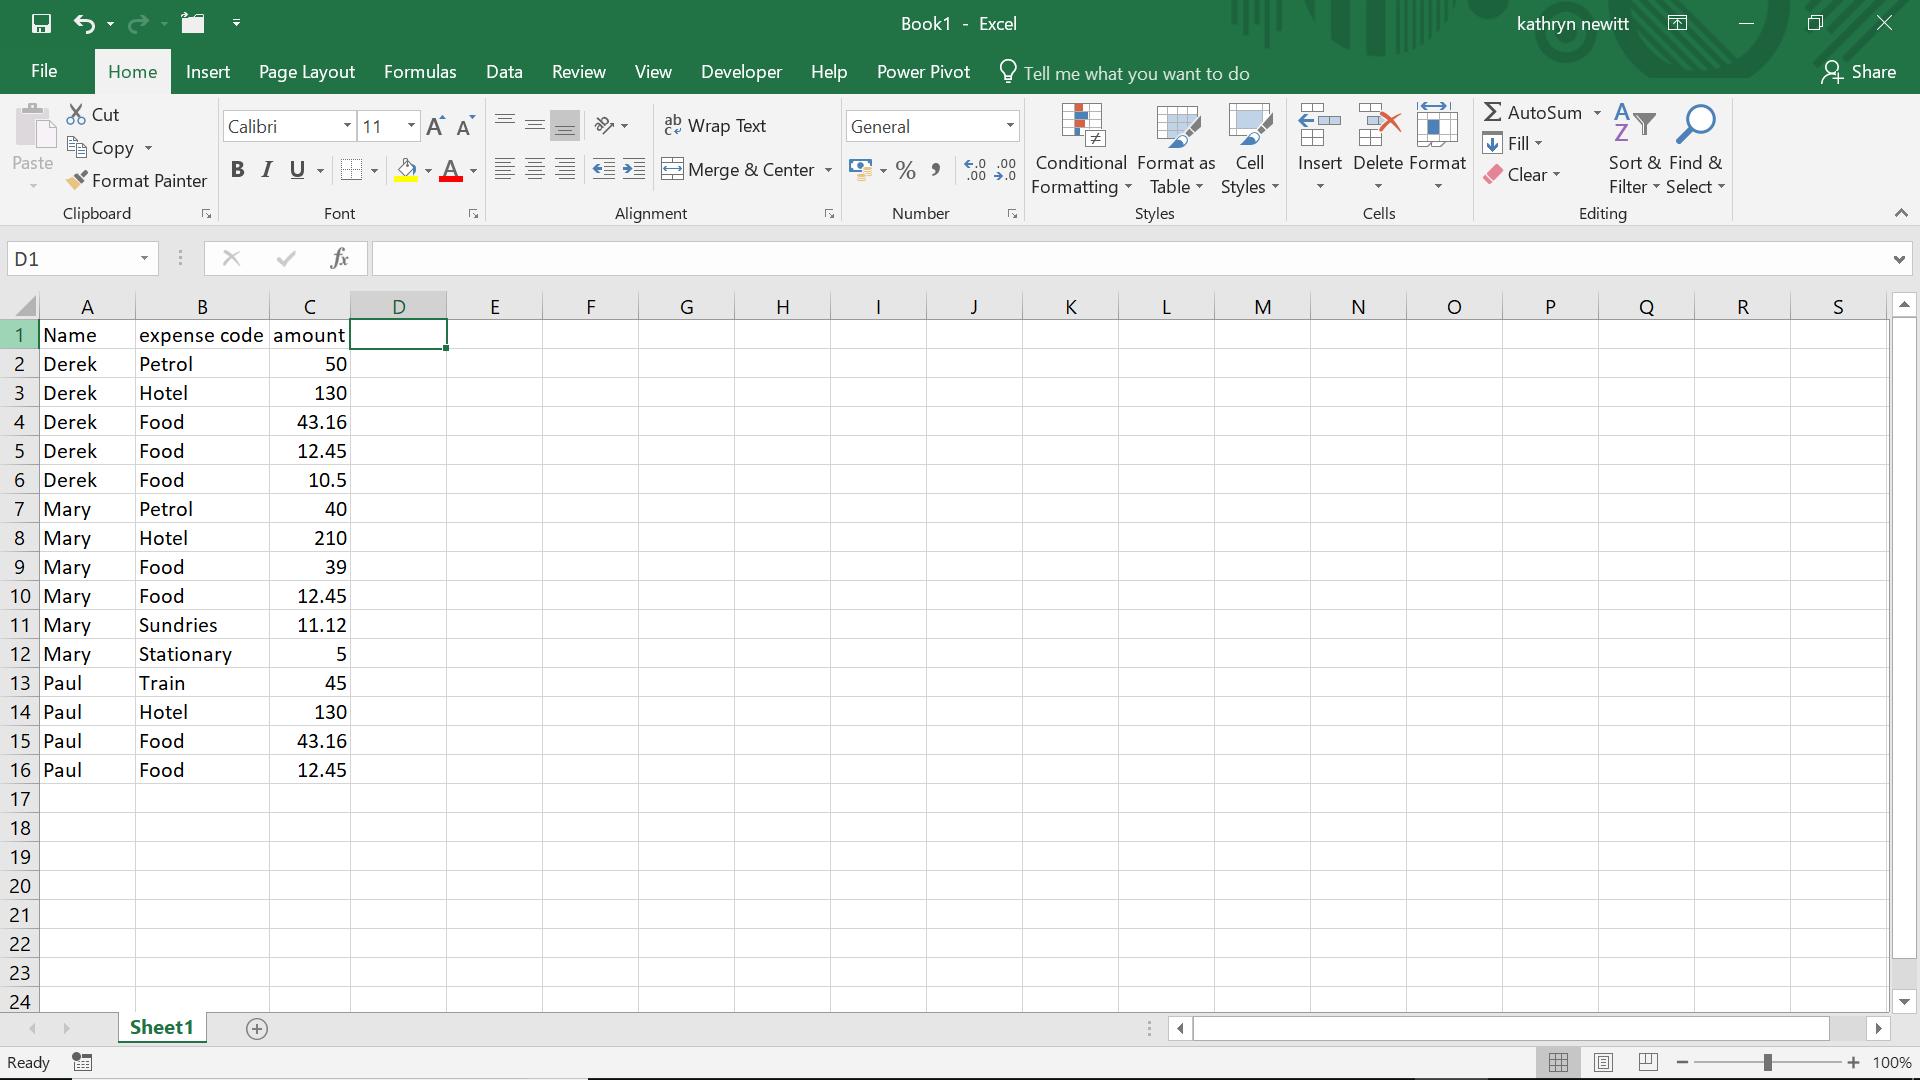
I have a list of expenses that my fictional salespeople have incurred in a month. I’d like to expand this to estimate what they might spend in the next 10 months.
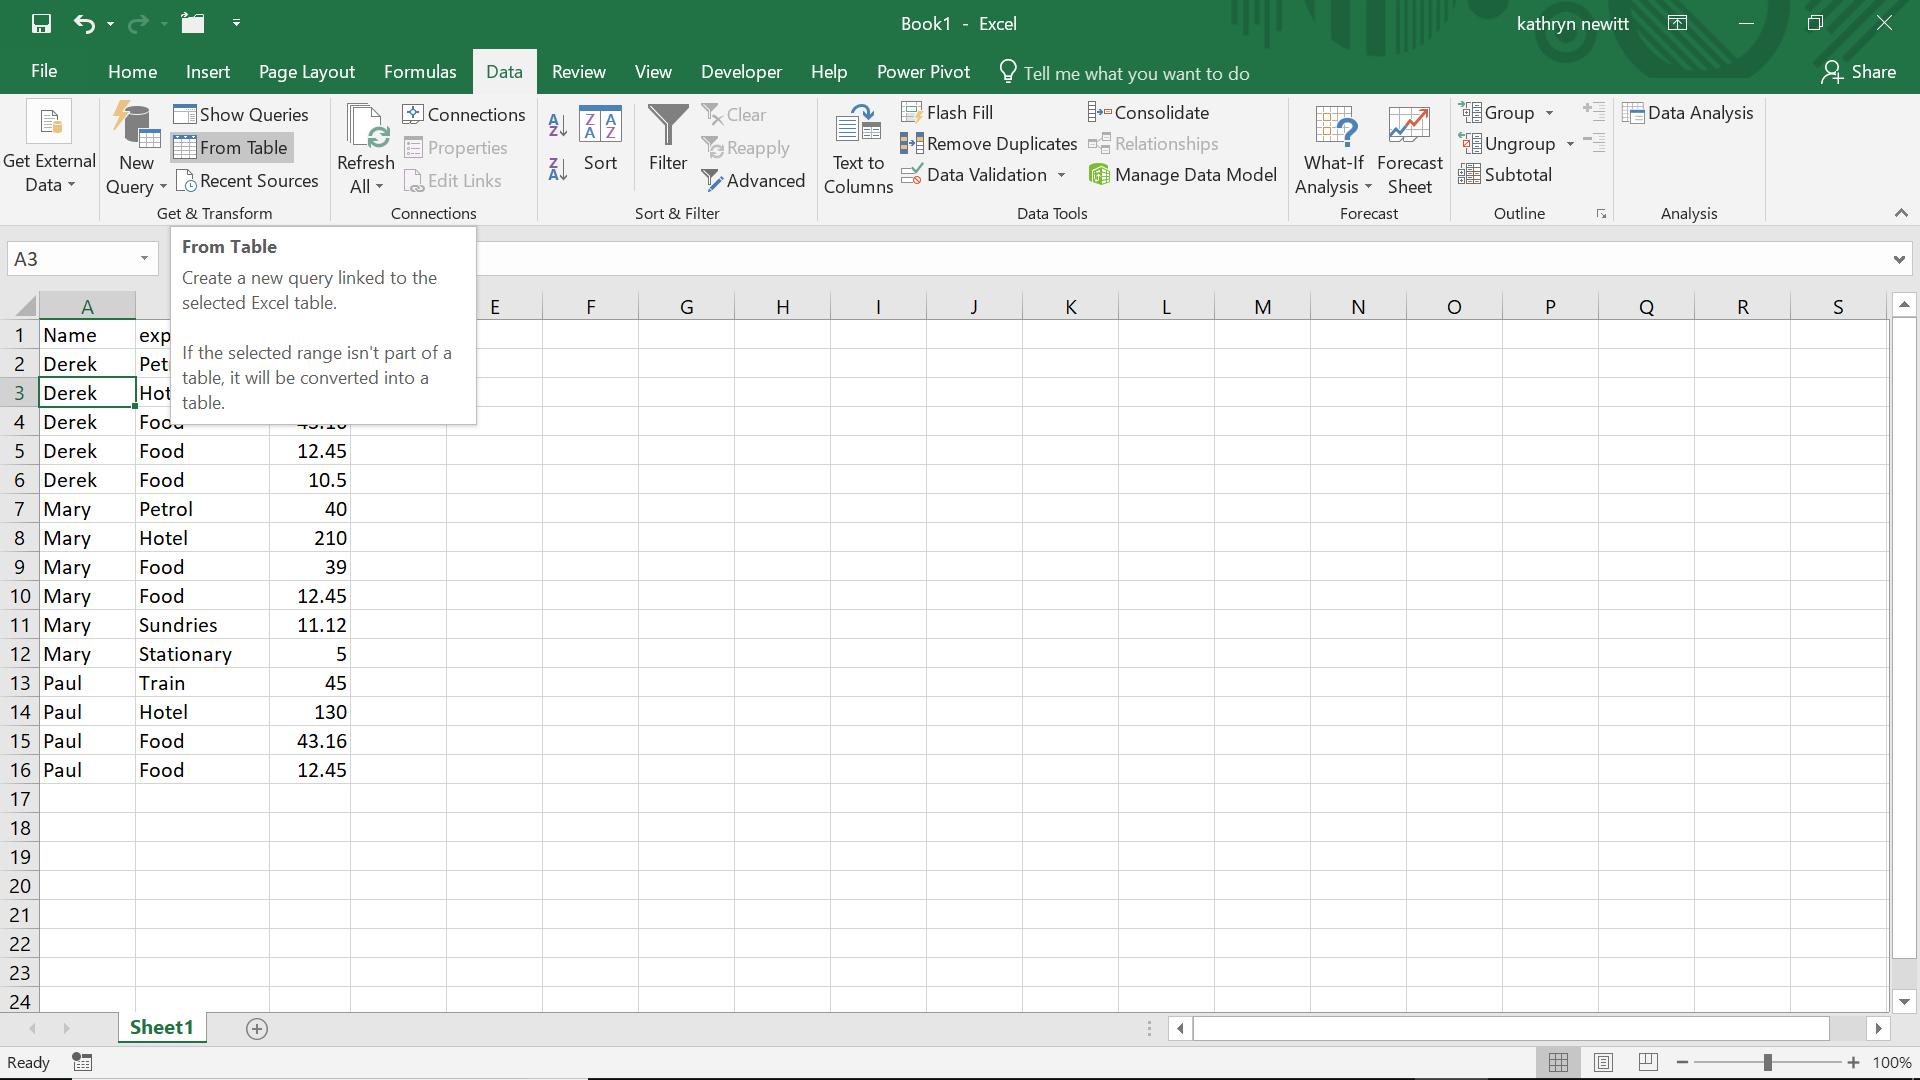
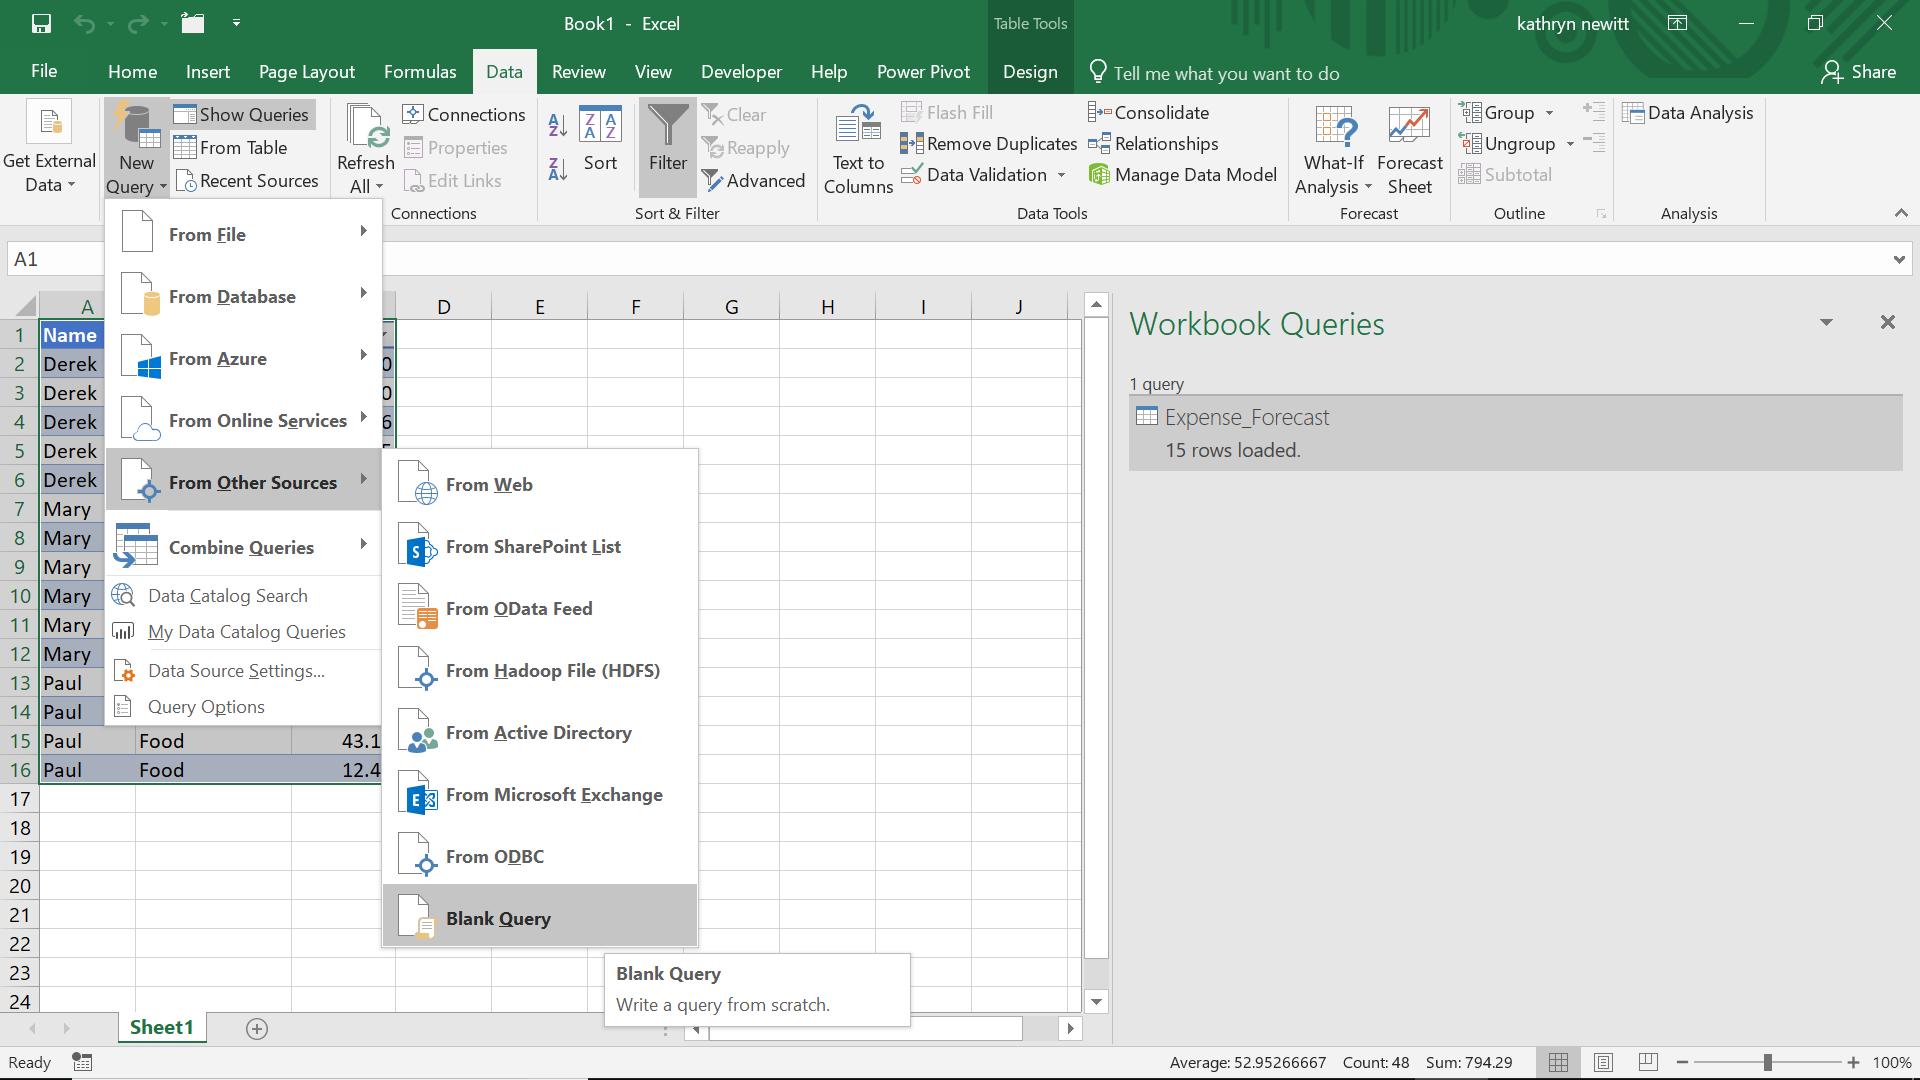
I start by creating a query from my expenses data, by choosing ‘From Table’ in the ‘Get and Transform’ section of the ‘Data Tab’:
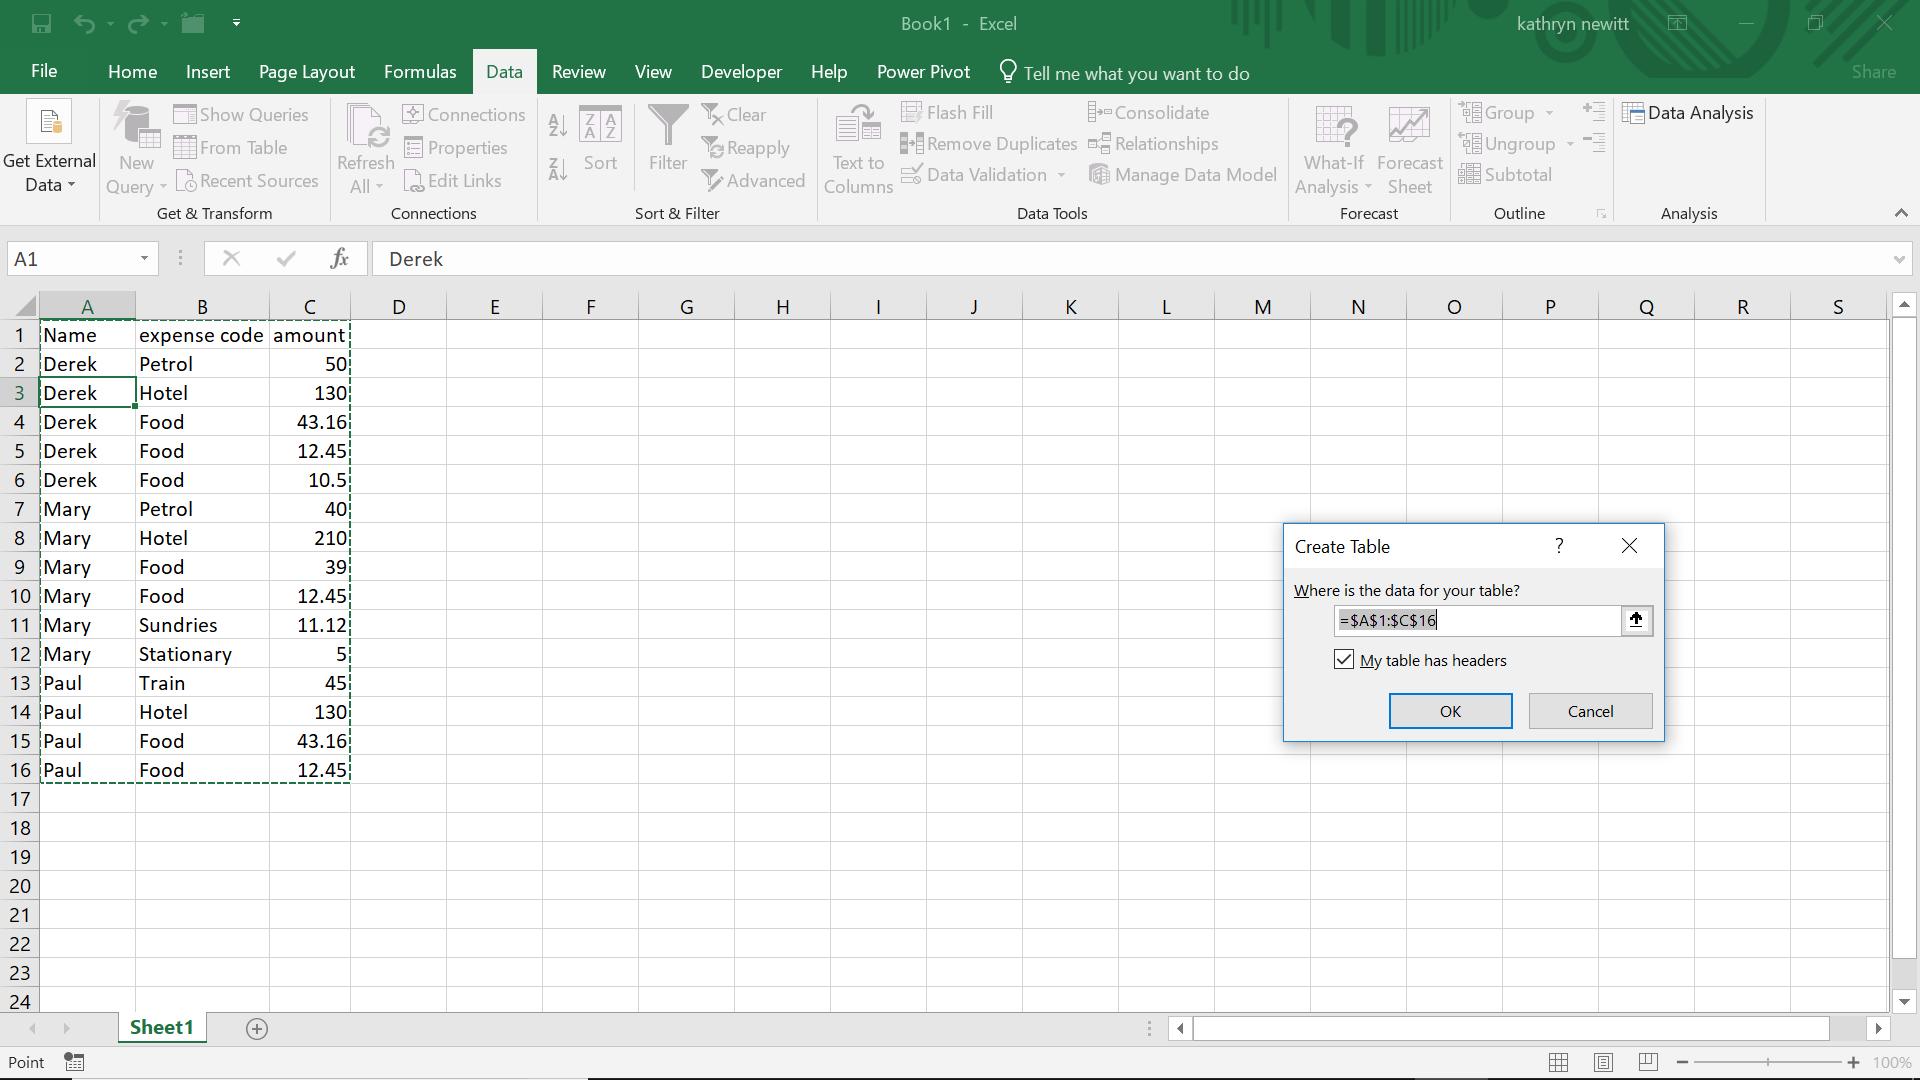
I confirm where my data is, and that the first line contains the headers. It doesn’t matter that my data is not currently in a table: Power Query will convert it to a table as part of the process.
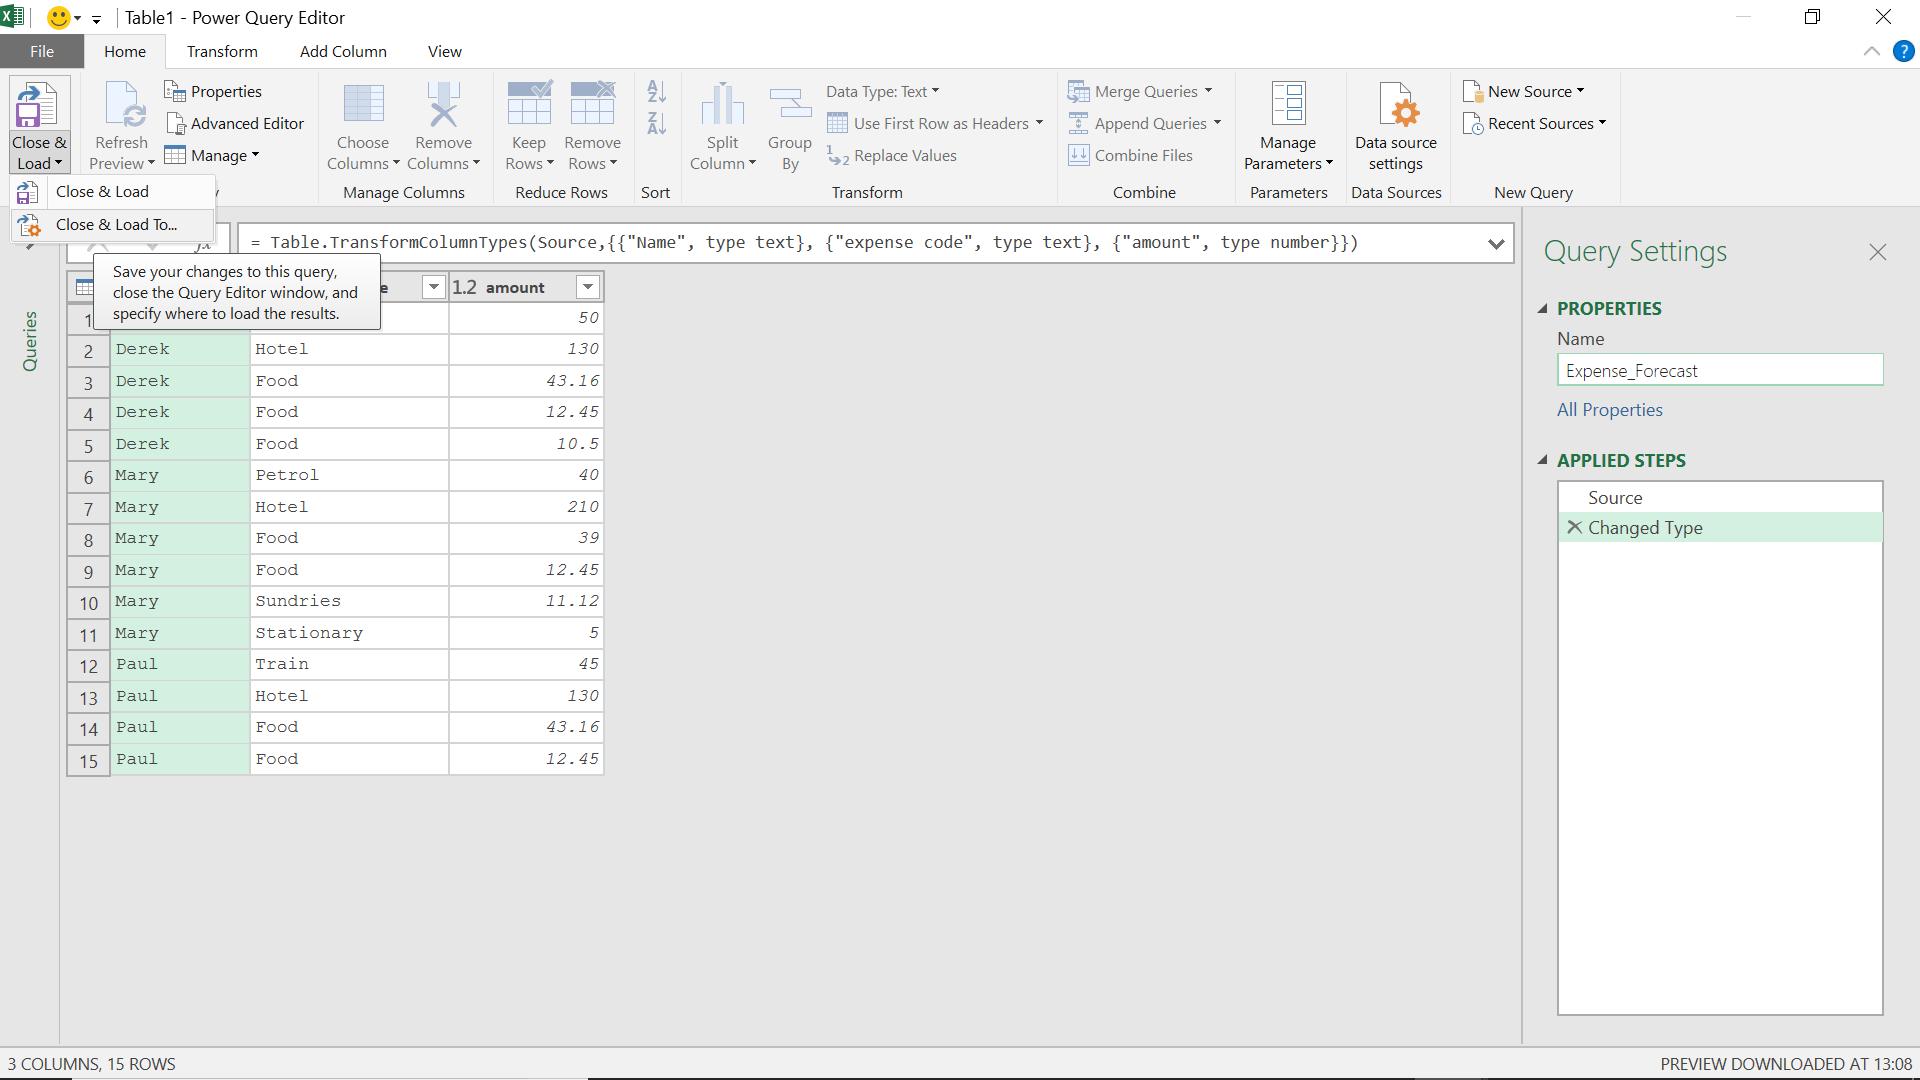
My query is shown below. I call it ‘Expense_Forecast’ and save it as connection only.
Now I want to create a list of months – this is easy enough to do by creating a new blank query from the ‘New Query’ option in the ‘Get and Transform’ section of the ‘Data’ tab, viz.
I create a list using basic list functionality (more on this may be found in Power Query: Birthday Lists.
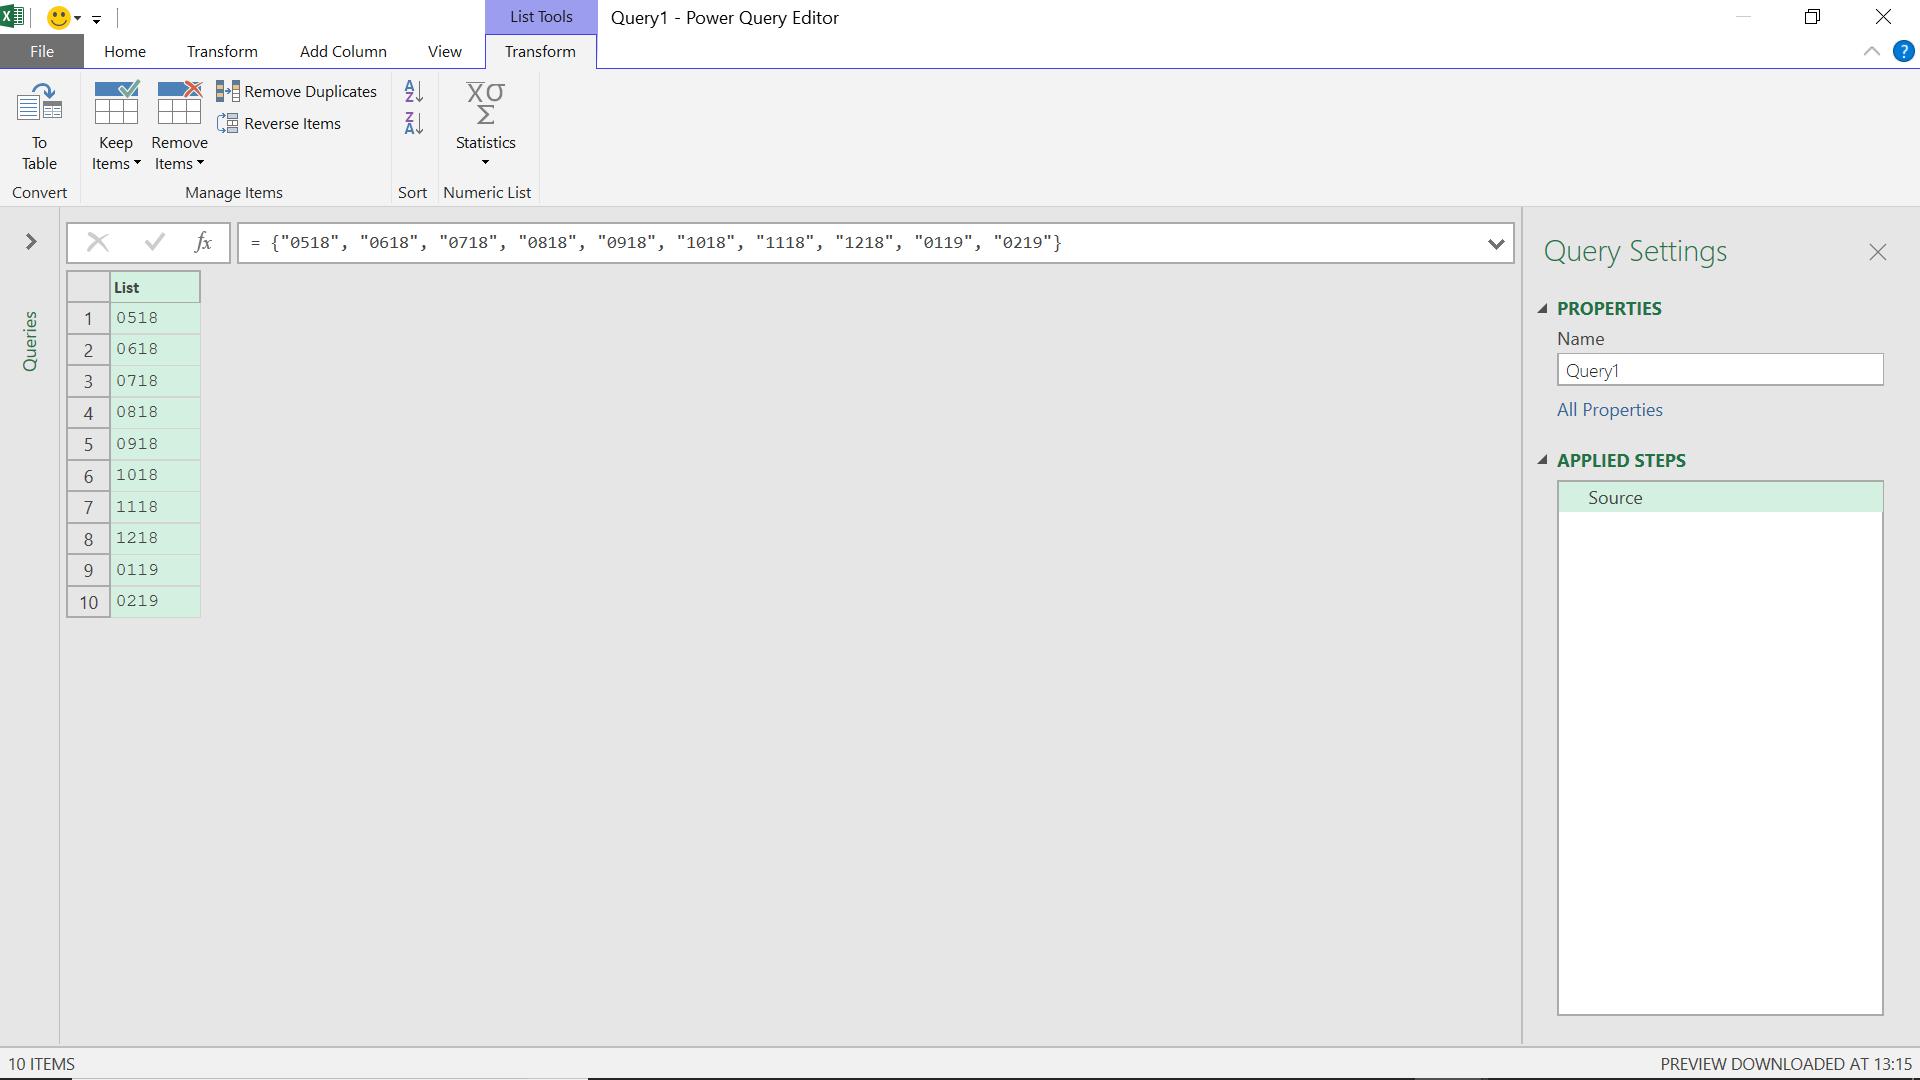
The formula I have used is
= {“0518”, “0618”, “0718”, “0818”, “0918”, “1018”, “1118”, “1218”, “0119”, “0219”}
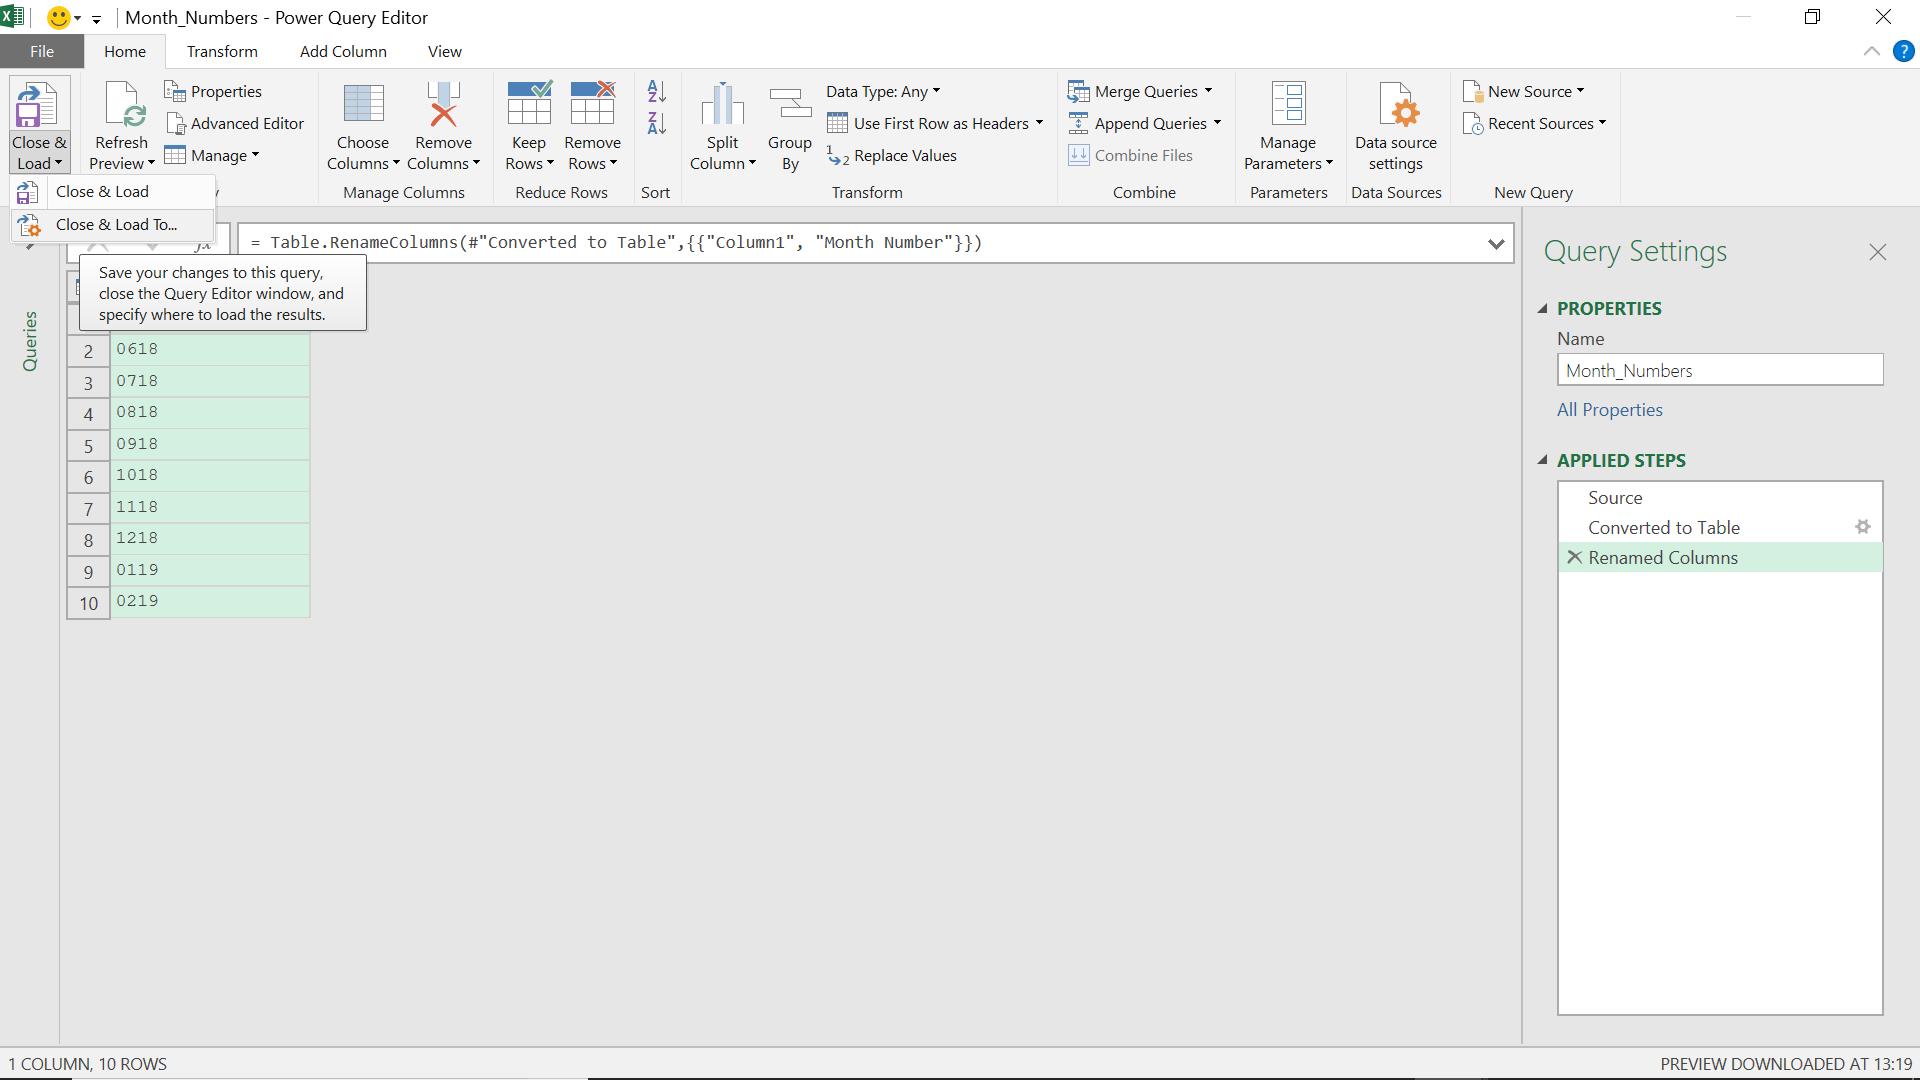
In order to link this list to my ‘Expense_Forecast’ table, I want this to be a table too, so I convert it using the ‘To Table’ option in the ‘Convert’ section of the ‘Transform Tab’. I rename my column and call the query ‘Month_Numbers’. I save this query as connection only too.
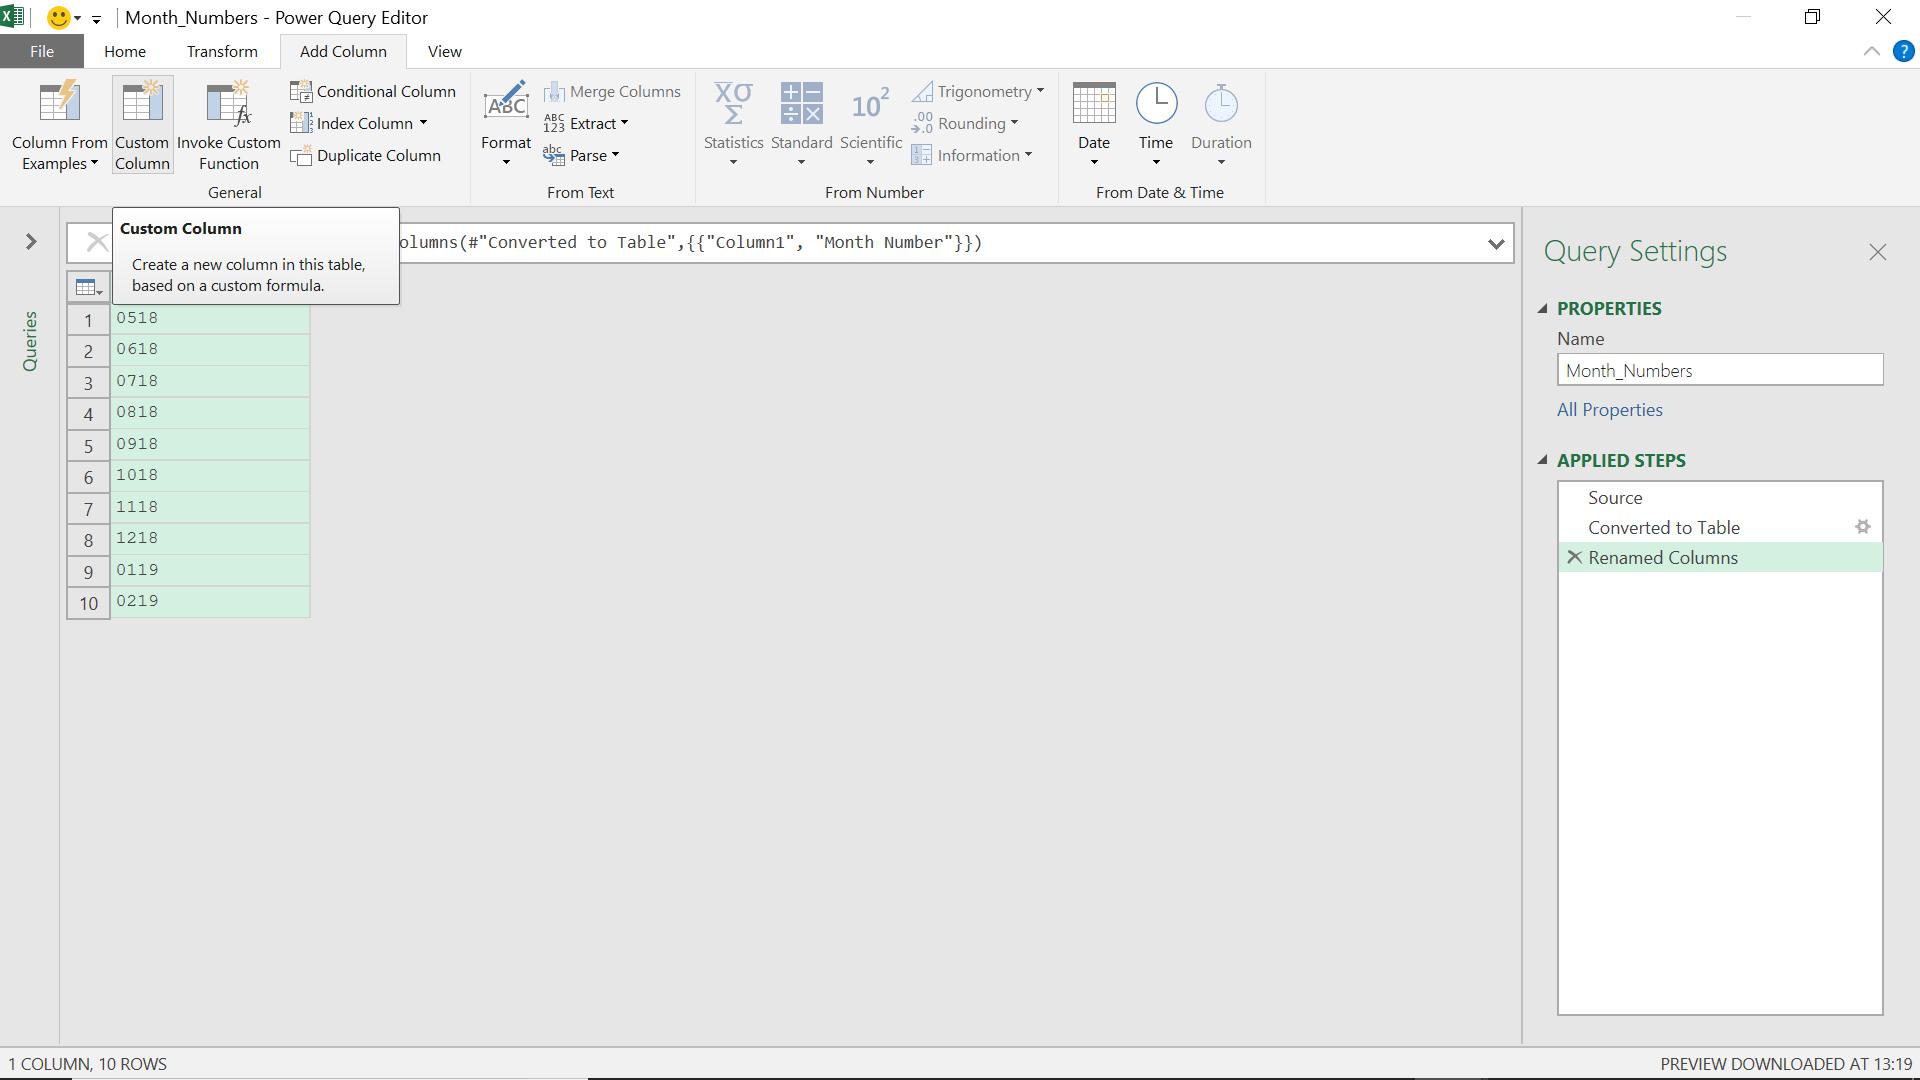
So now I need to combine my information. I decide to do this by adding the expense information to my ‘Week_Numbers’ query. I can do this by going to the ‘Add Column’ tab. I choose to add a ‘Custom Column’.
If I expand the ‘Queries’ pane to the left of my screen, I can use the name of my other query in the column.
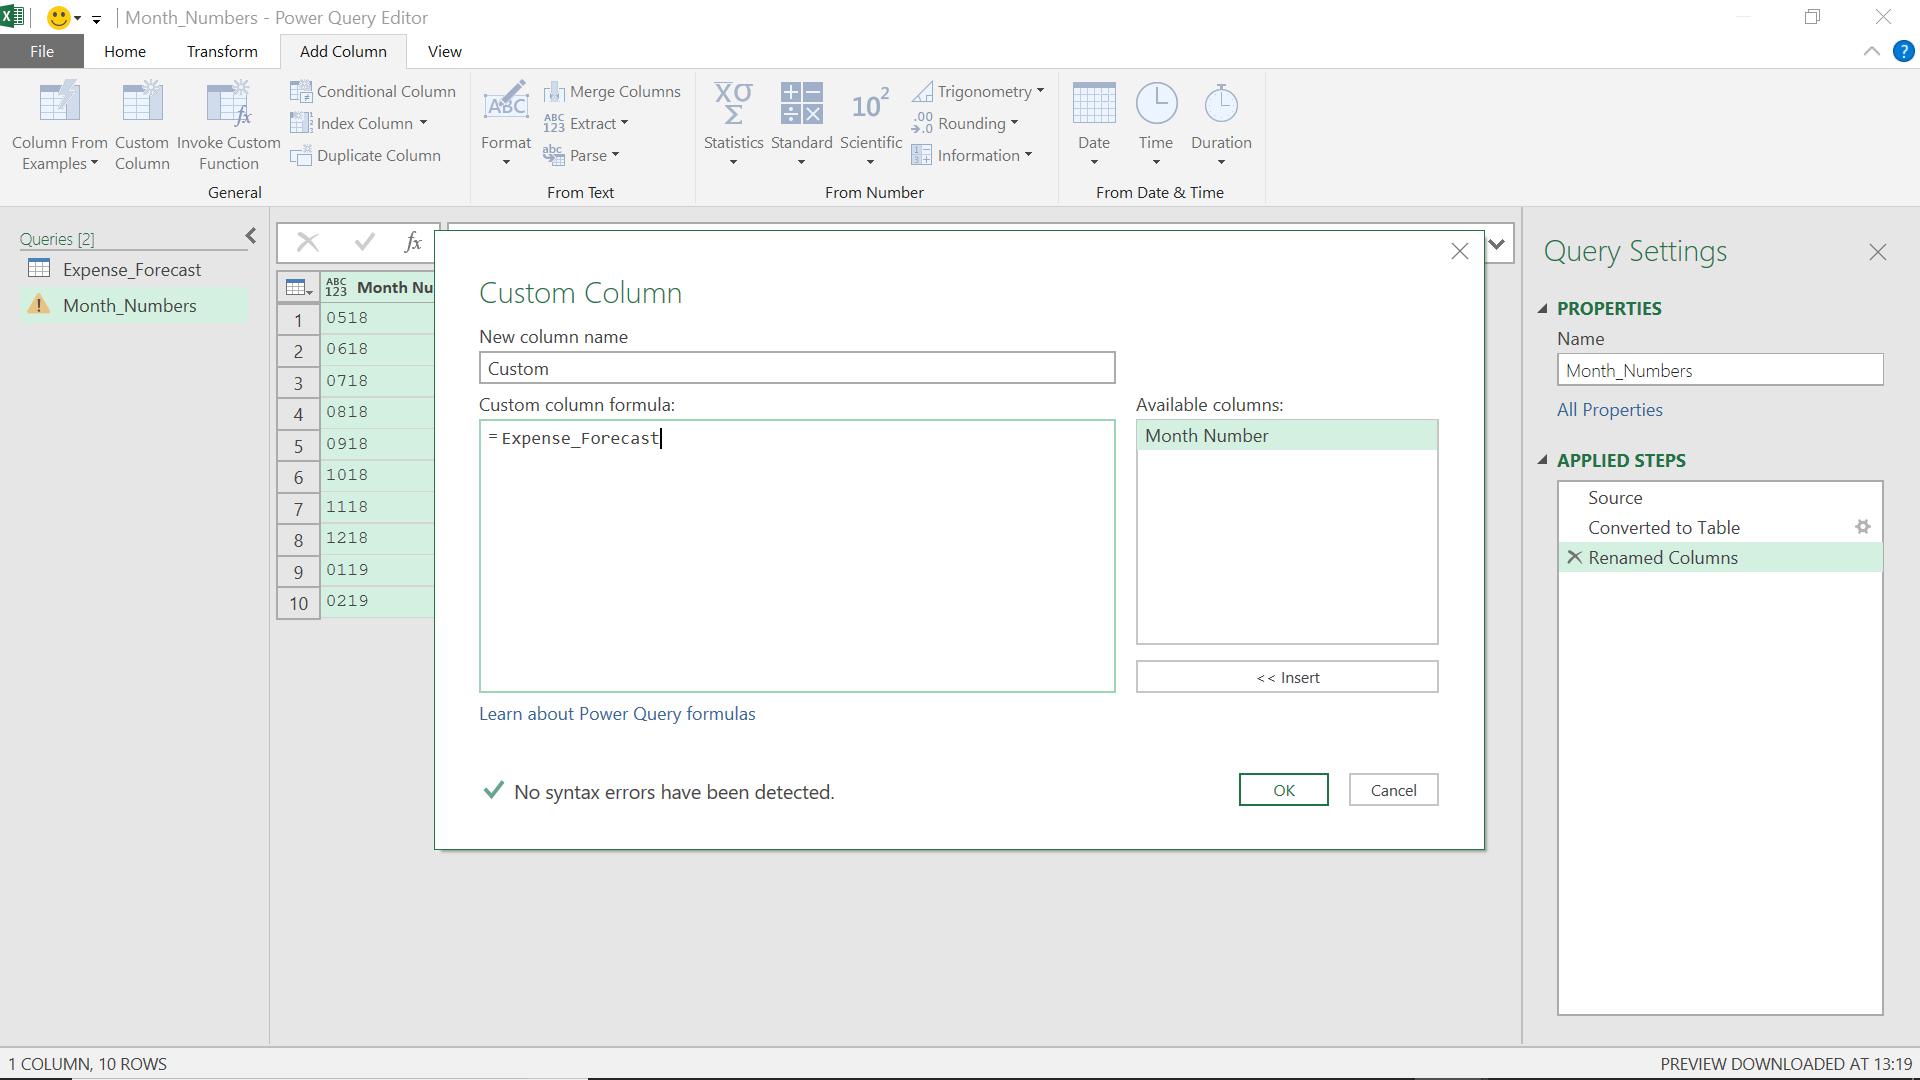
This will create a new column for my ‘Expense_Forecast’ data.
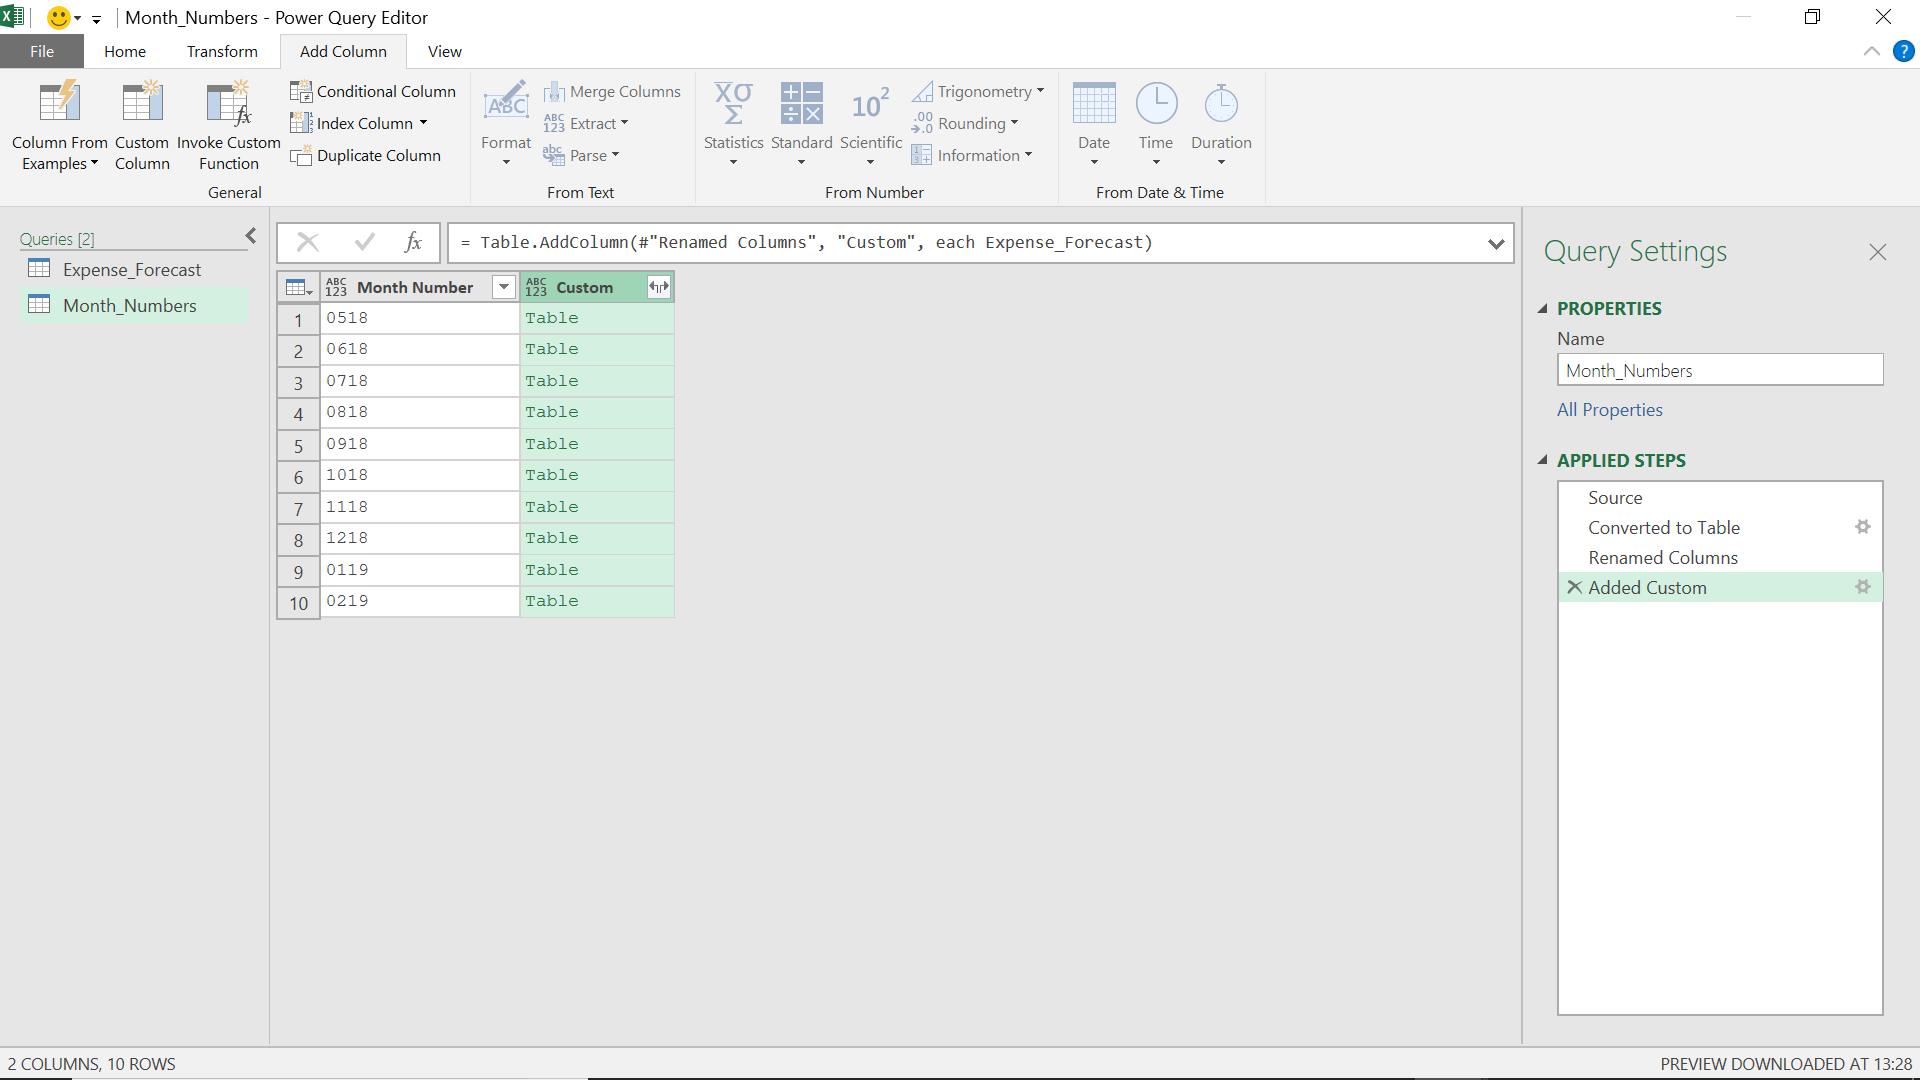
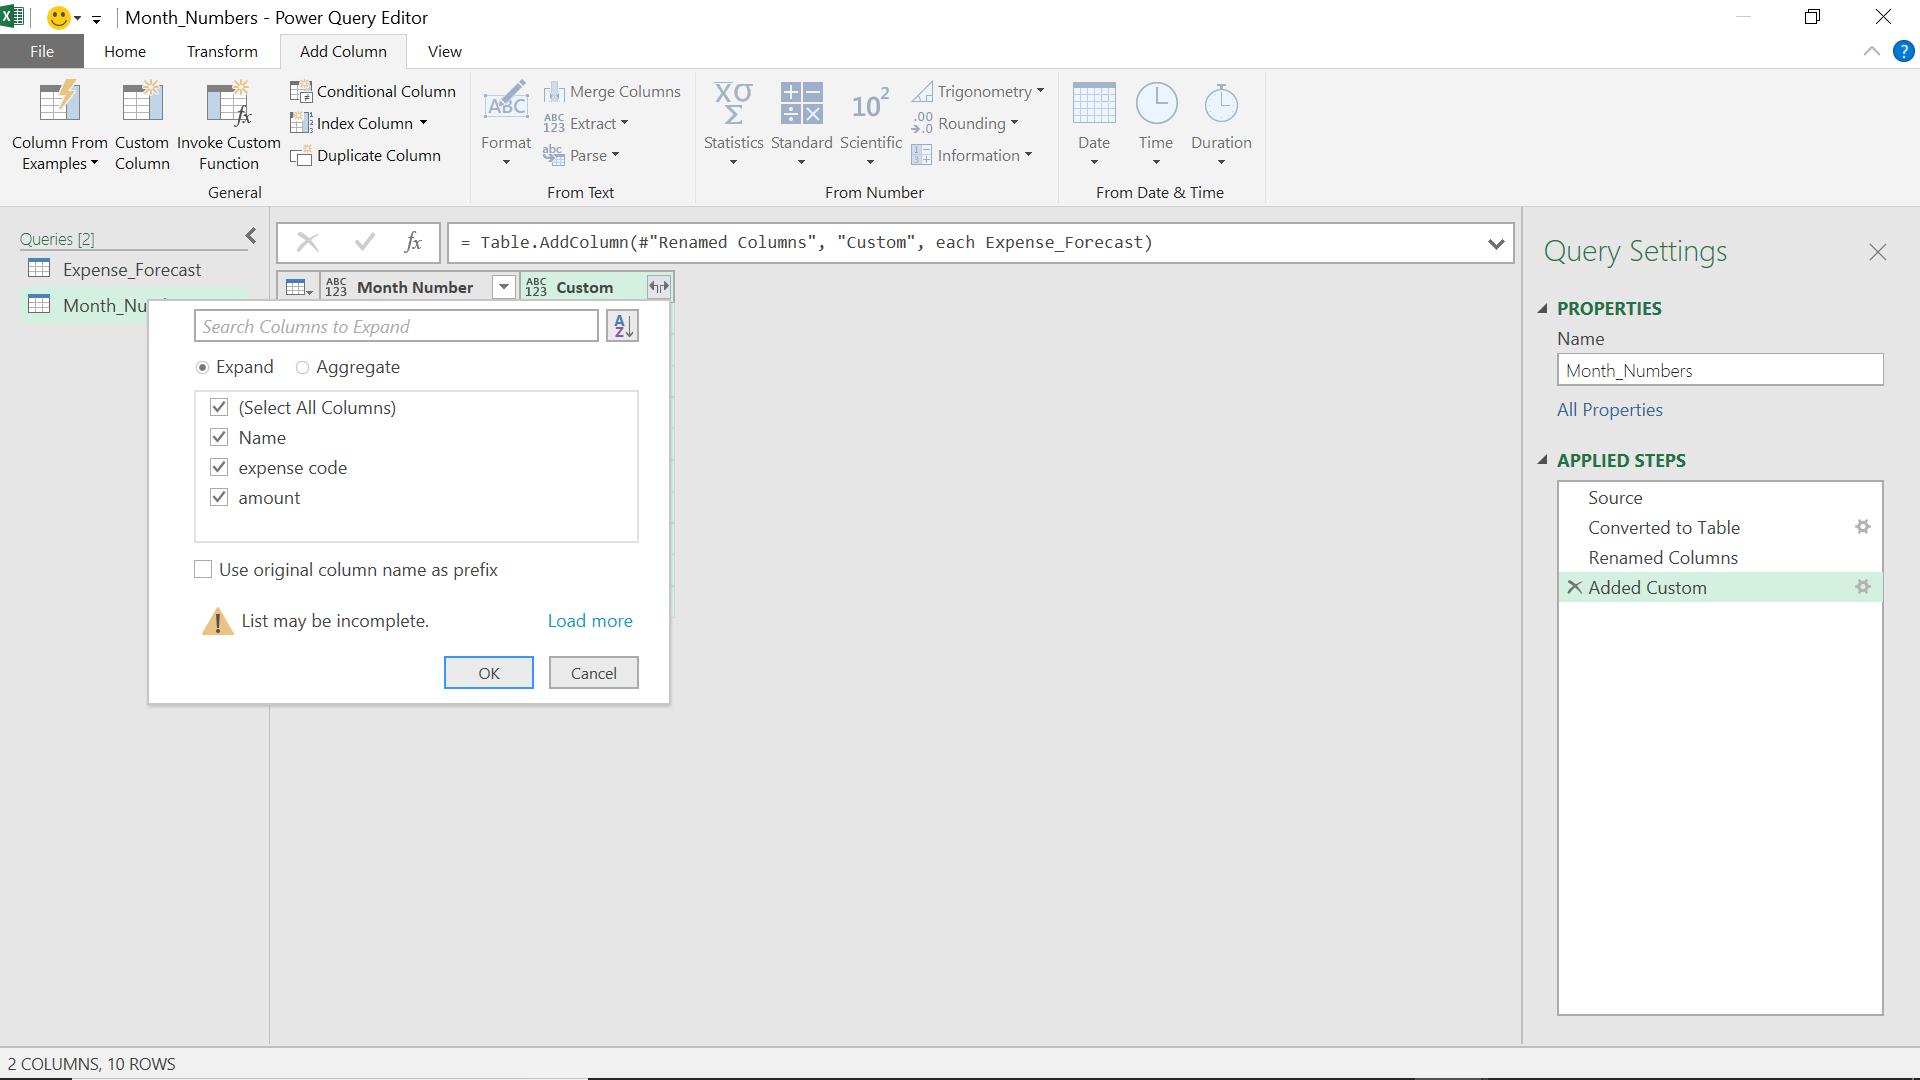
I can now expand my column to show the data in the table – in this case I will choose all the available data. All I need to change, is to untick the ‘Use original column name as prefix’ option (no, I don’t know why it’s the default either!).
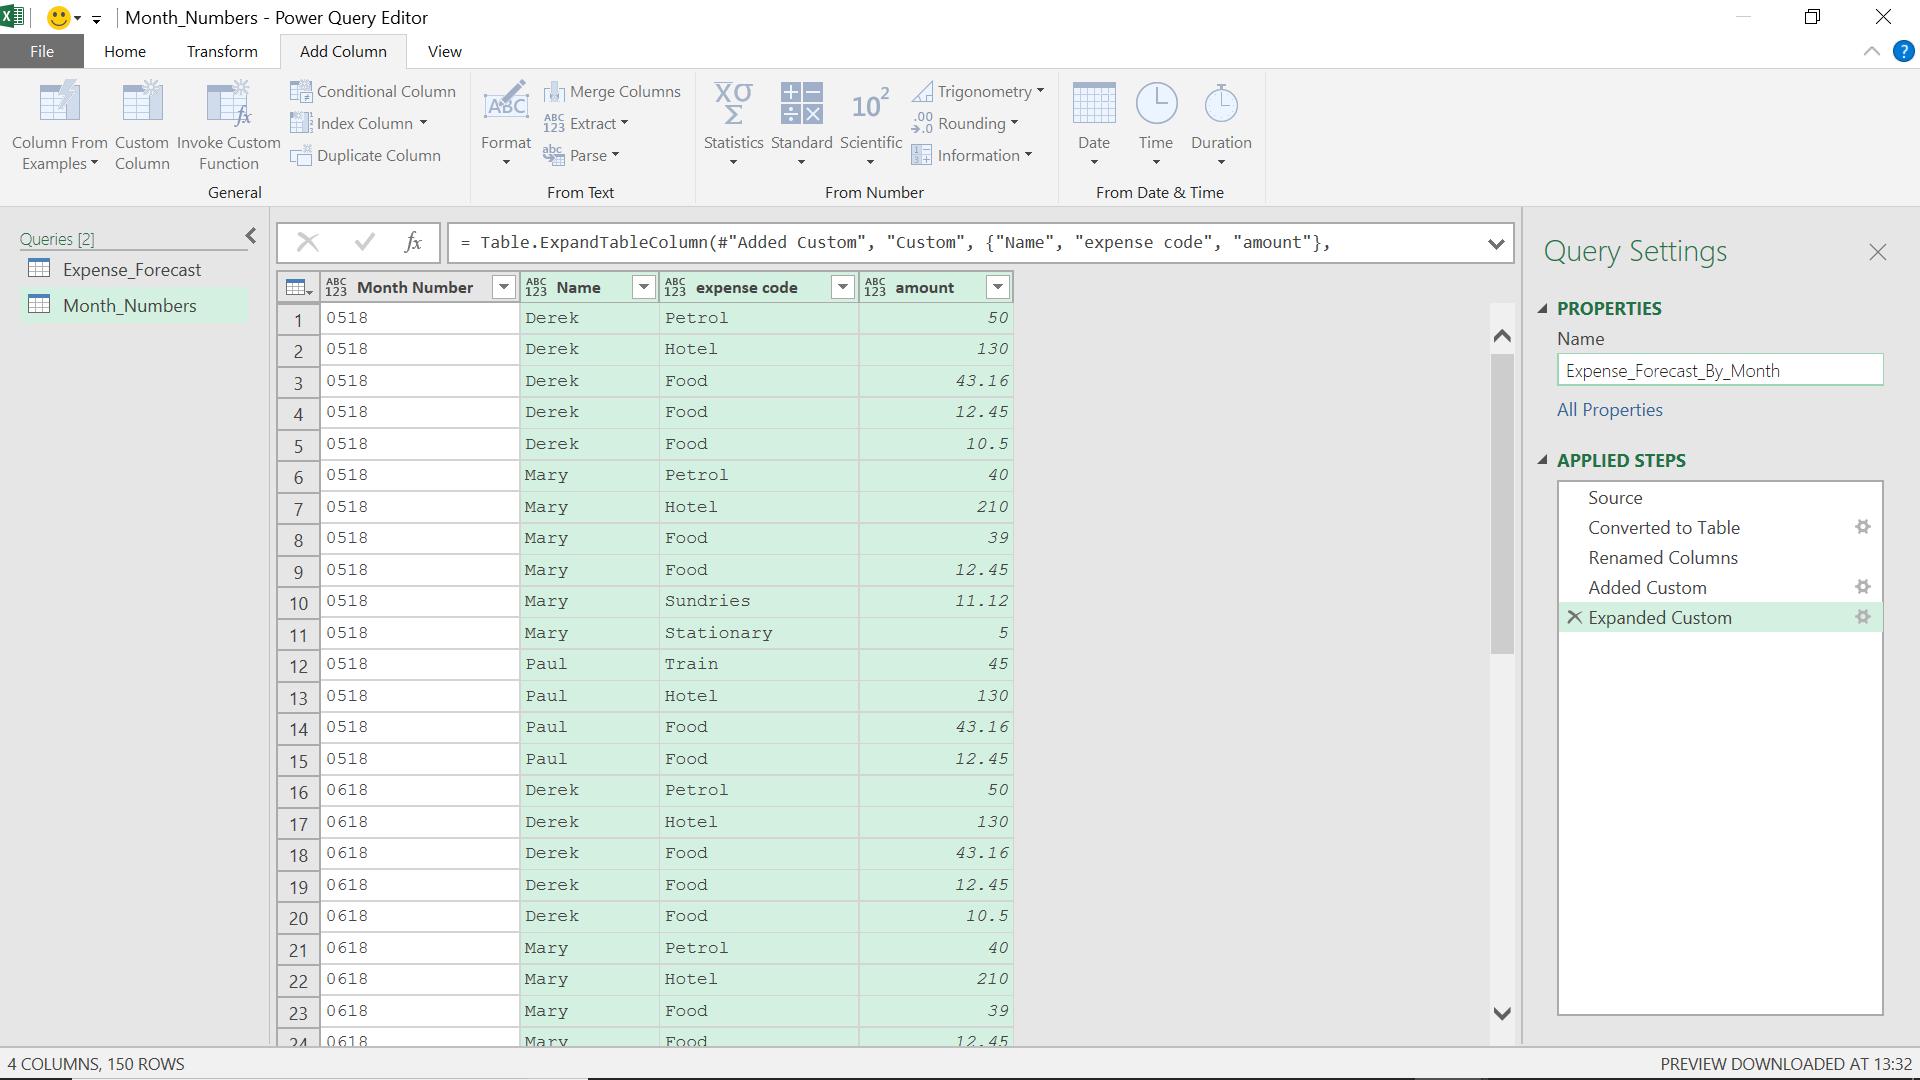
I can then see the basic expense forecast for each employee and category for the next 10 months. I can then upload this data to Excel or PowerPivot and further investigate with the effects of inflation and predicted workloads.
Want to read more about Power Query? A complete list of all our Power Query blogs can be found here. Come back next time for more ways to use Power Query!