
Power Query: Group and Conquer
17 May 2017
Welcome to our Power Query blog. Today I look at grouping.
Grouping in Power Query is not intended to replace the excellent tools available in Excel spreadsheets to group and summarise data. Power Query’s talent is its ability to manipulate very large data sets, and it can be useful to group data before uploading to an Excel spreadsheet so that there are less rows to deal with.
In Two (Queries) Become One, I created a query to merge ‘Order Charges’ with ‘Group’ information.
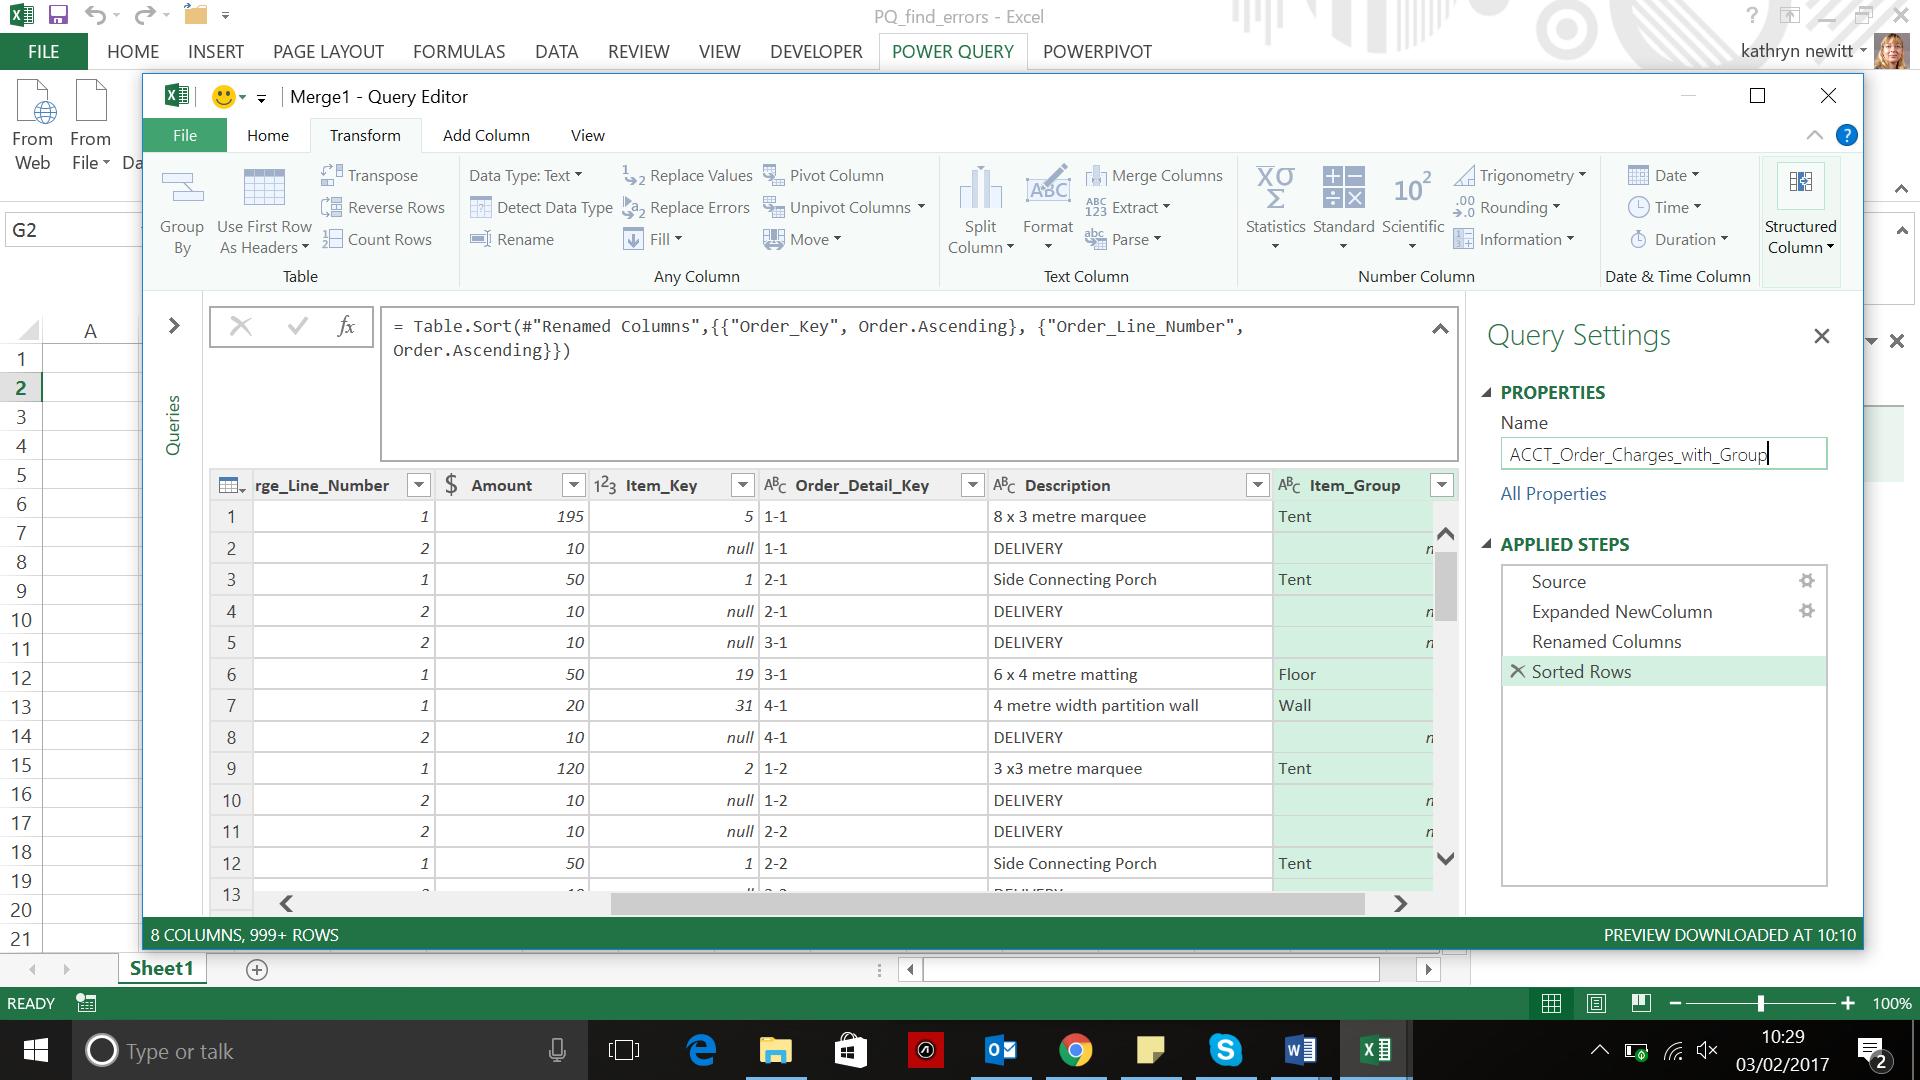
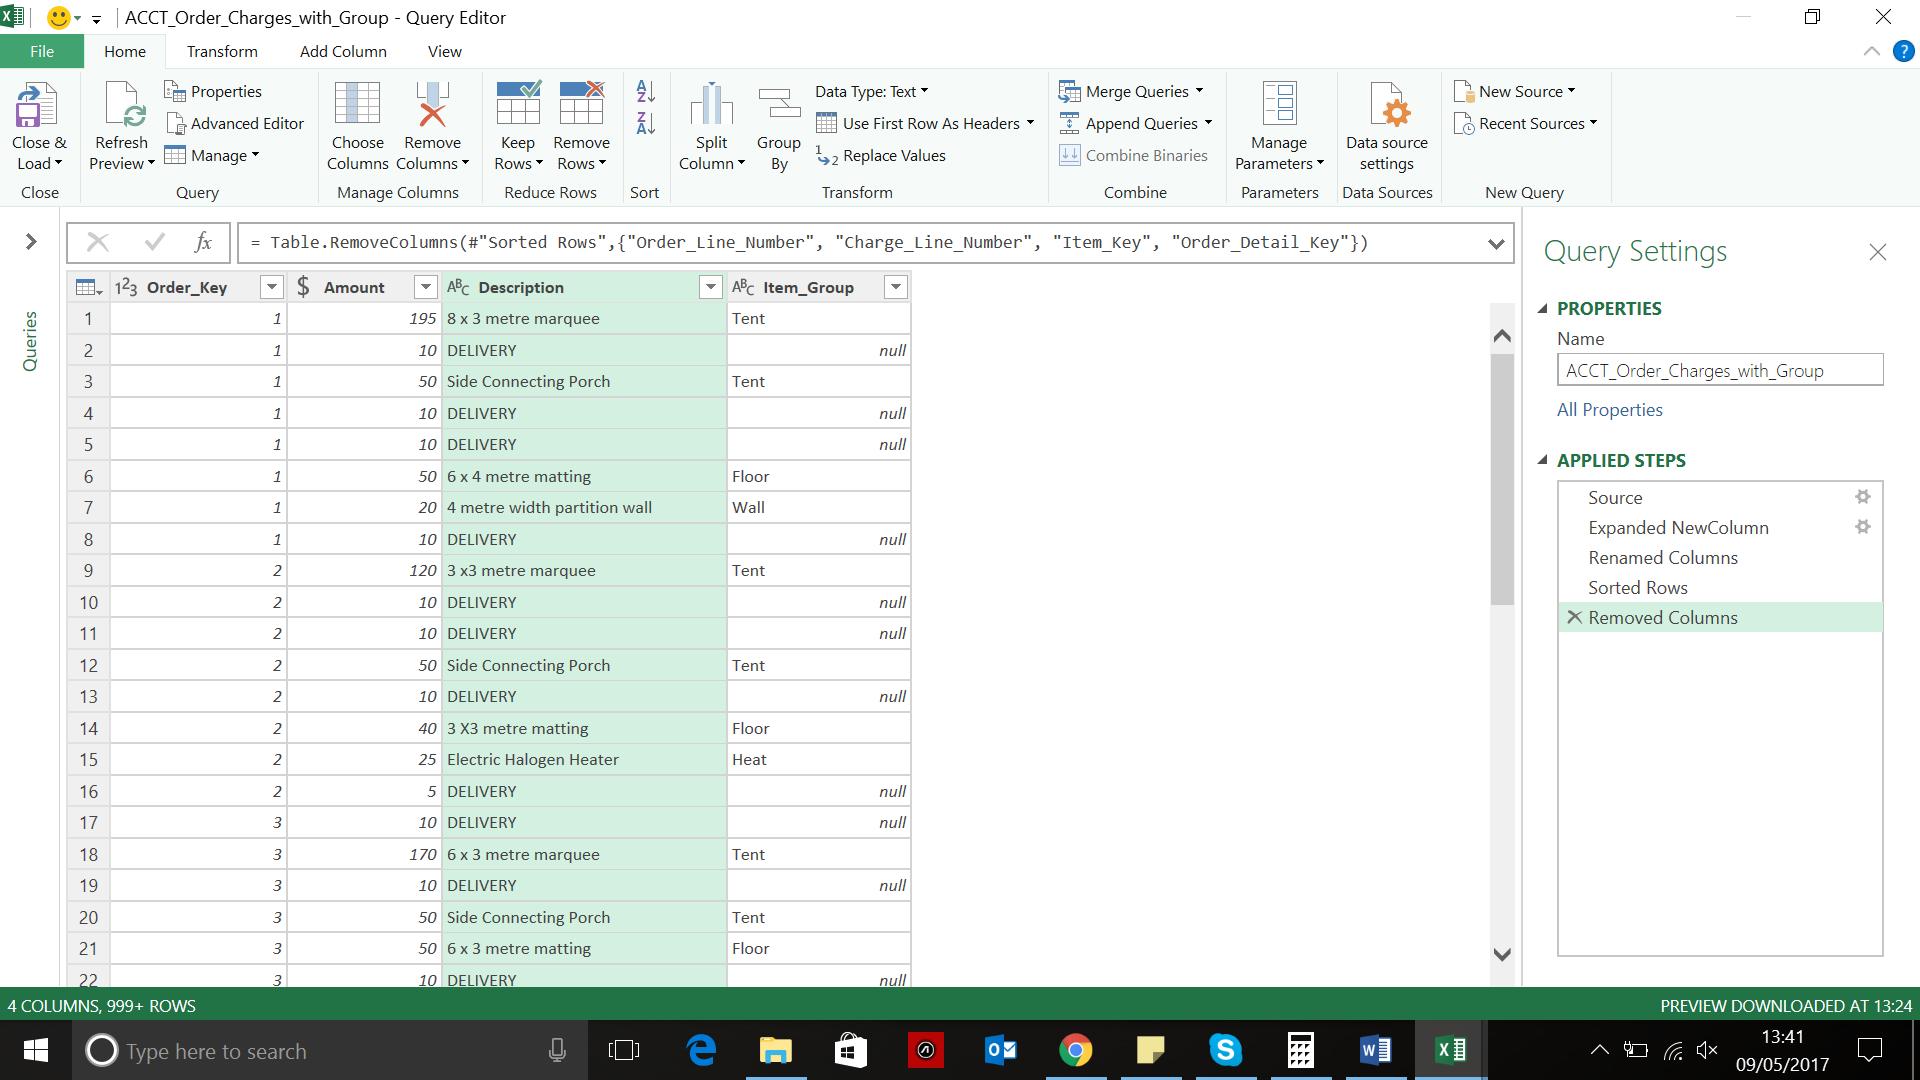
I will go back to this query and try some grouping. To keep things easy to follow, I’ll begin by removing the columns I am not interested right now – the various keys that would help me to link to other queries.
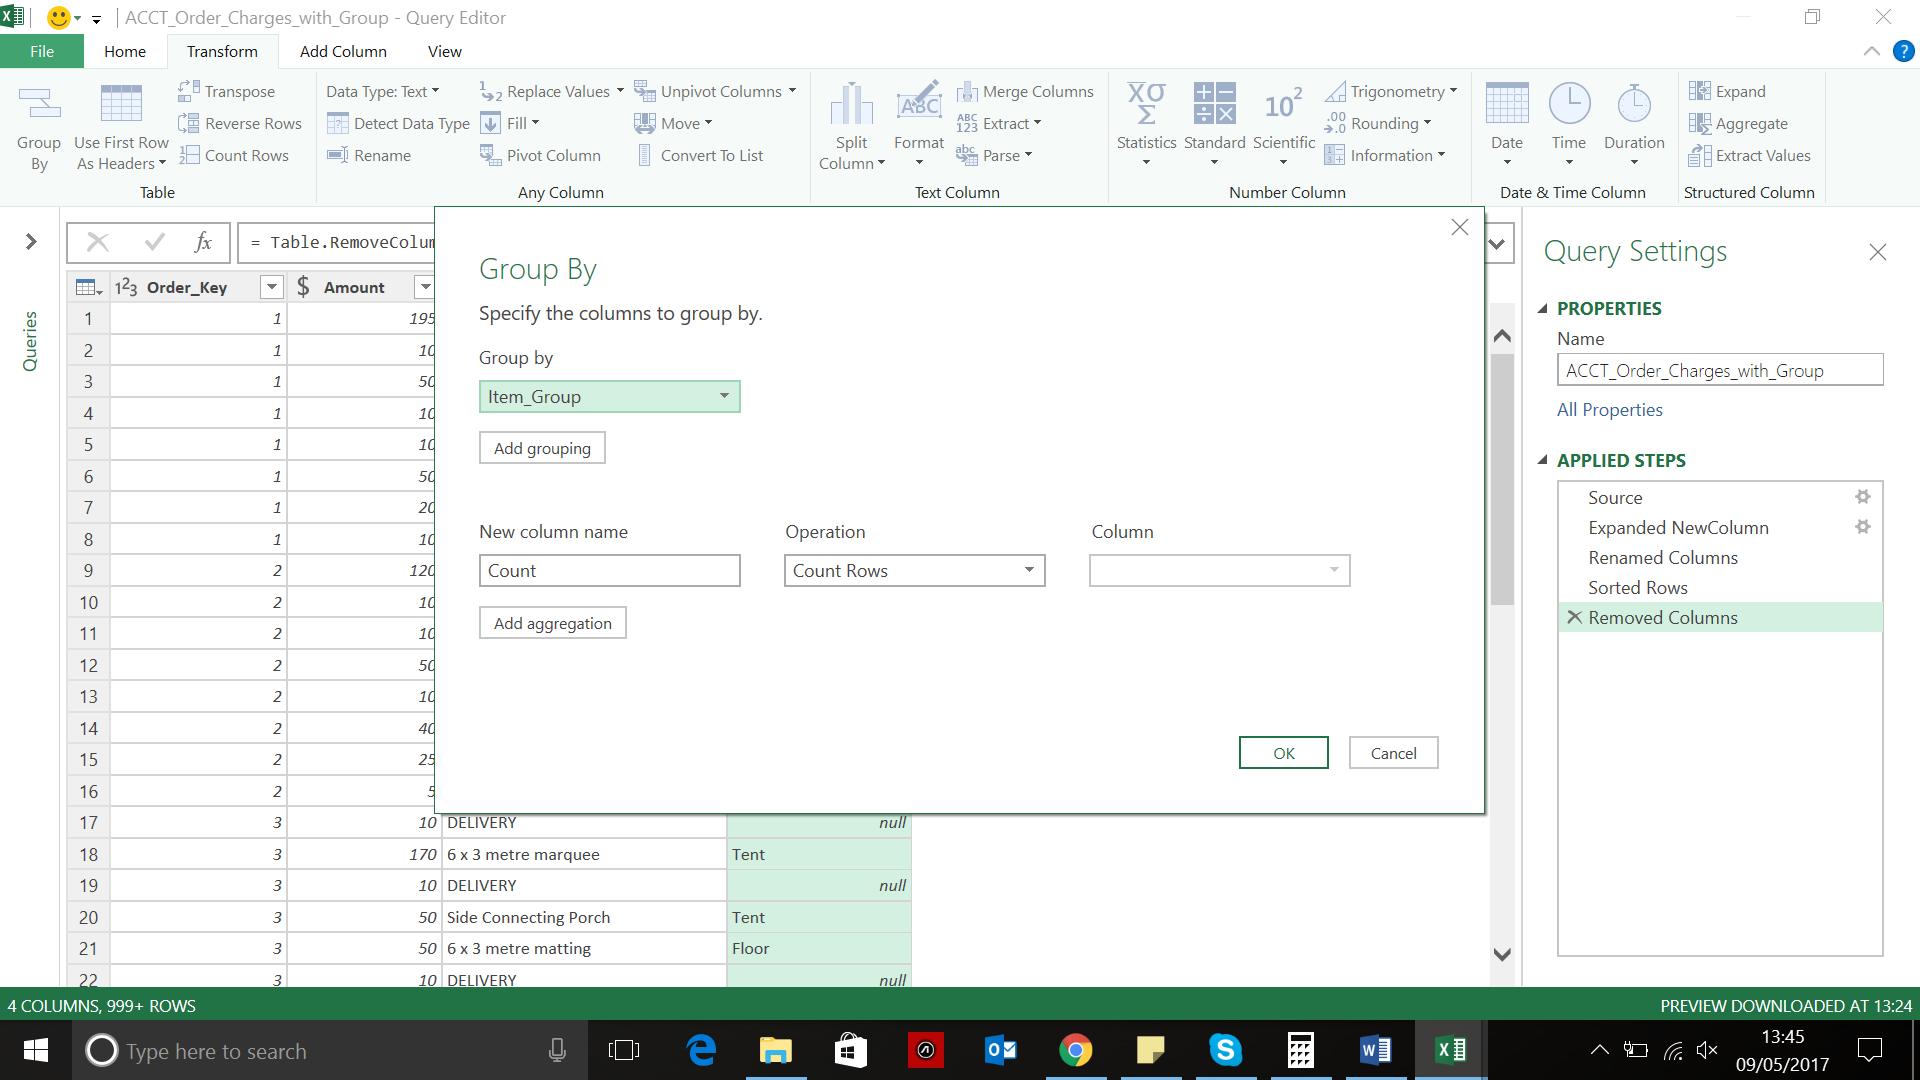
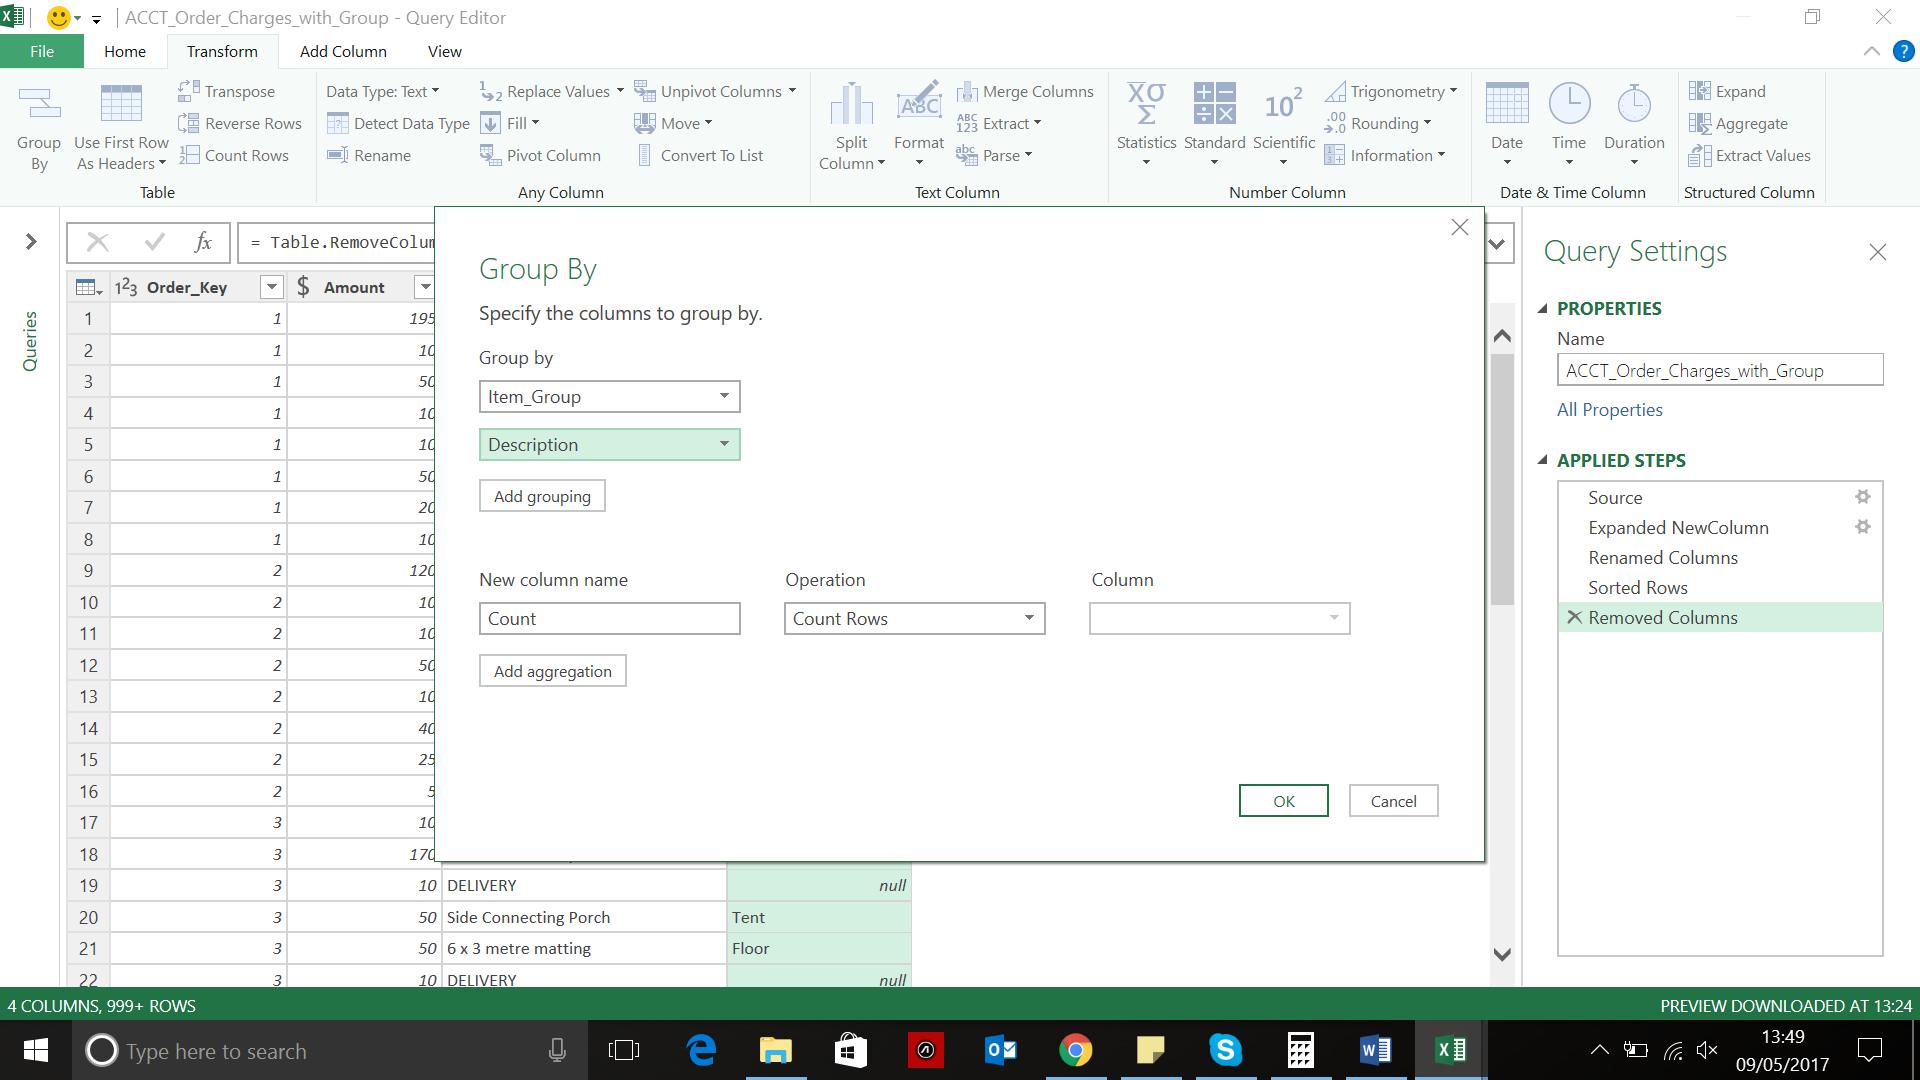
I am going to group by Item_Group and Description. I select the Item_Group column, and then choose the ‘Group By’ section on the ‘Transform’ tab:
There are a few options to explore here – I begin by using the ‘Add grouping’ button to include the Description column.
Power Query has helpfully suggested what I might like to do – count the rows. I’d like a better name for this column – ‘Items Sold’ , and then I want to use the ‘Add aggregation’ button to add another column to sum my Amount.
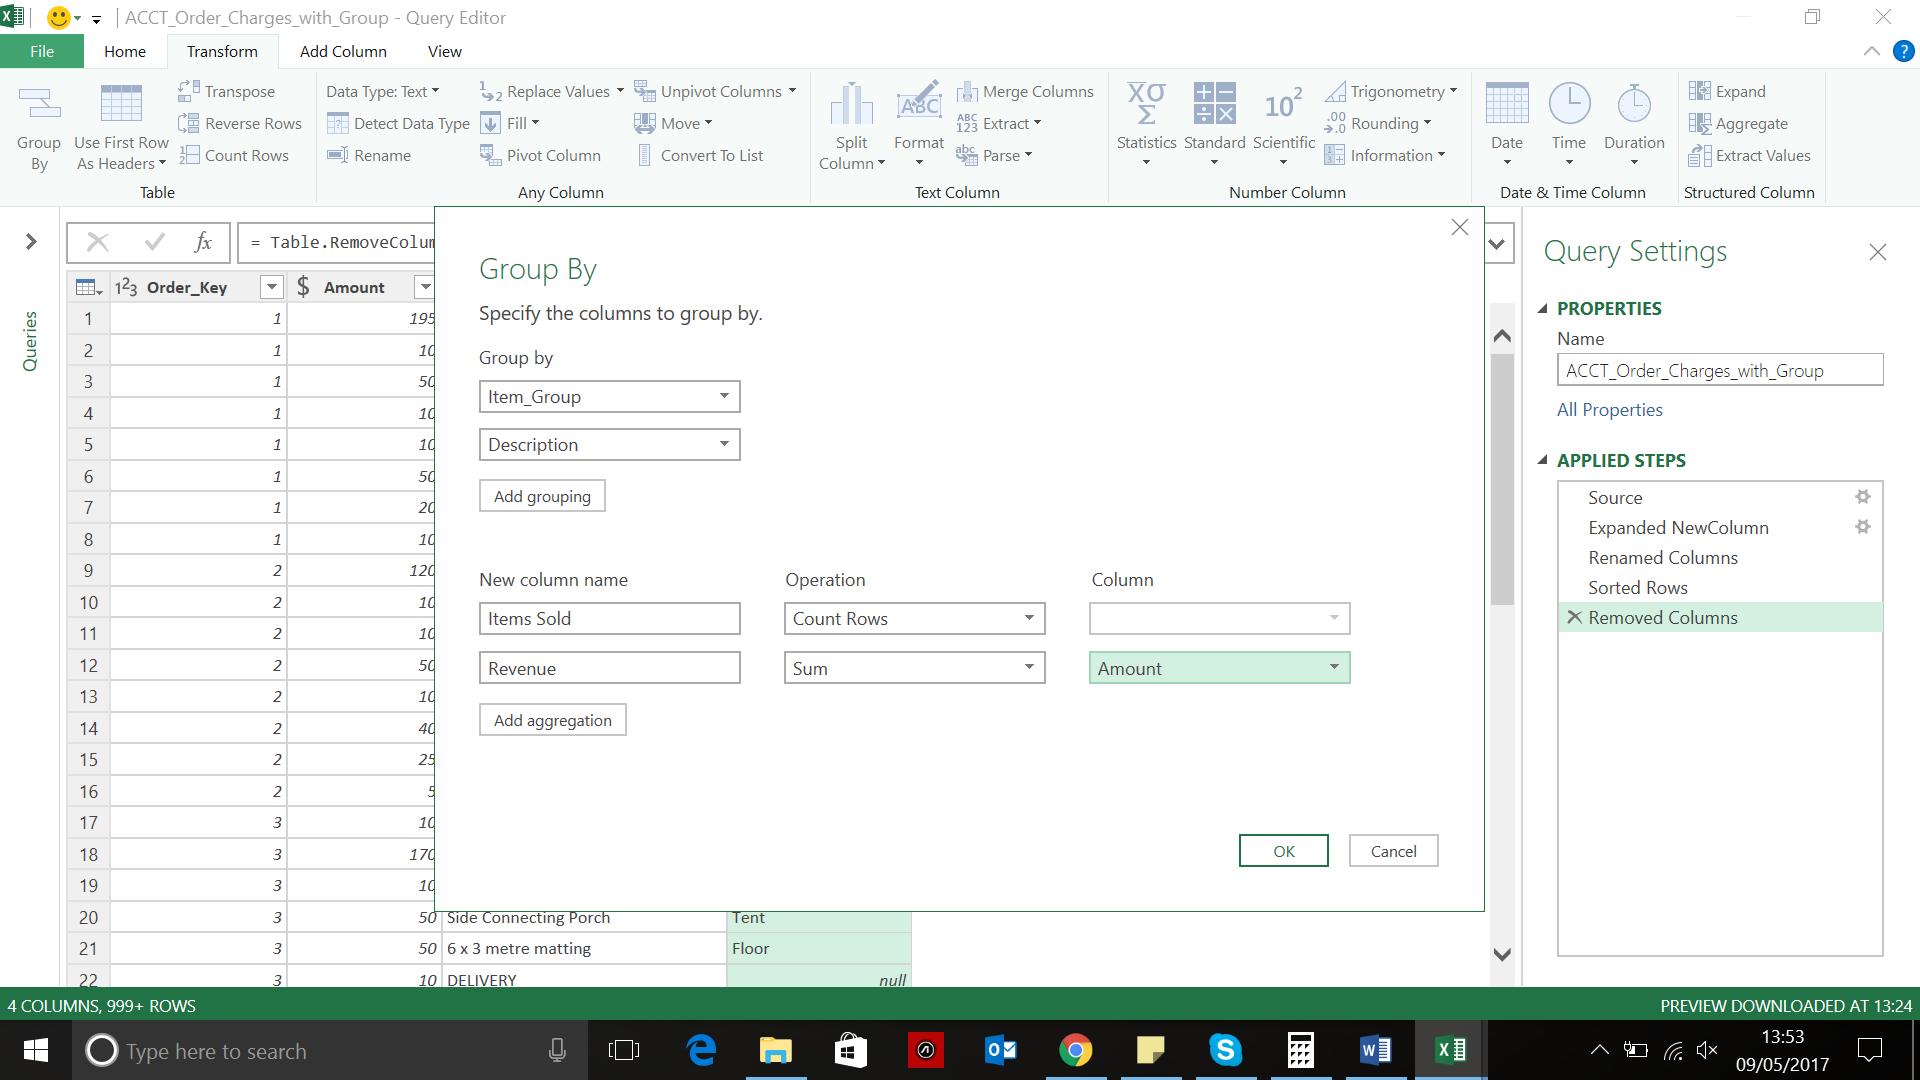
The column section is populated if Power Query needs to know what the ‘Operation’ should be performed on. I click OK to see how my data has been grouped, and then apply a sort.
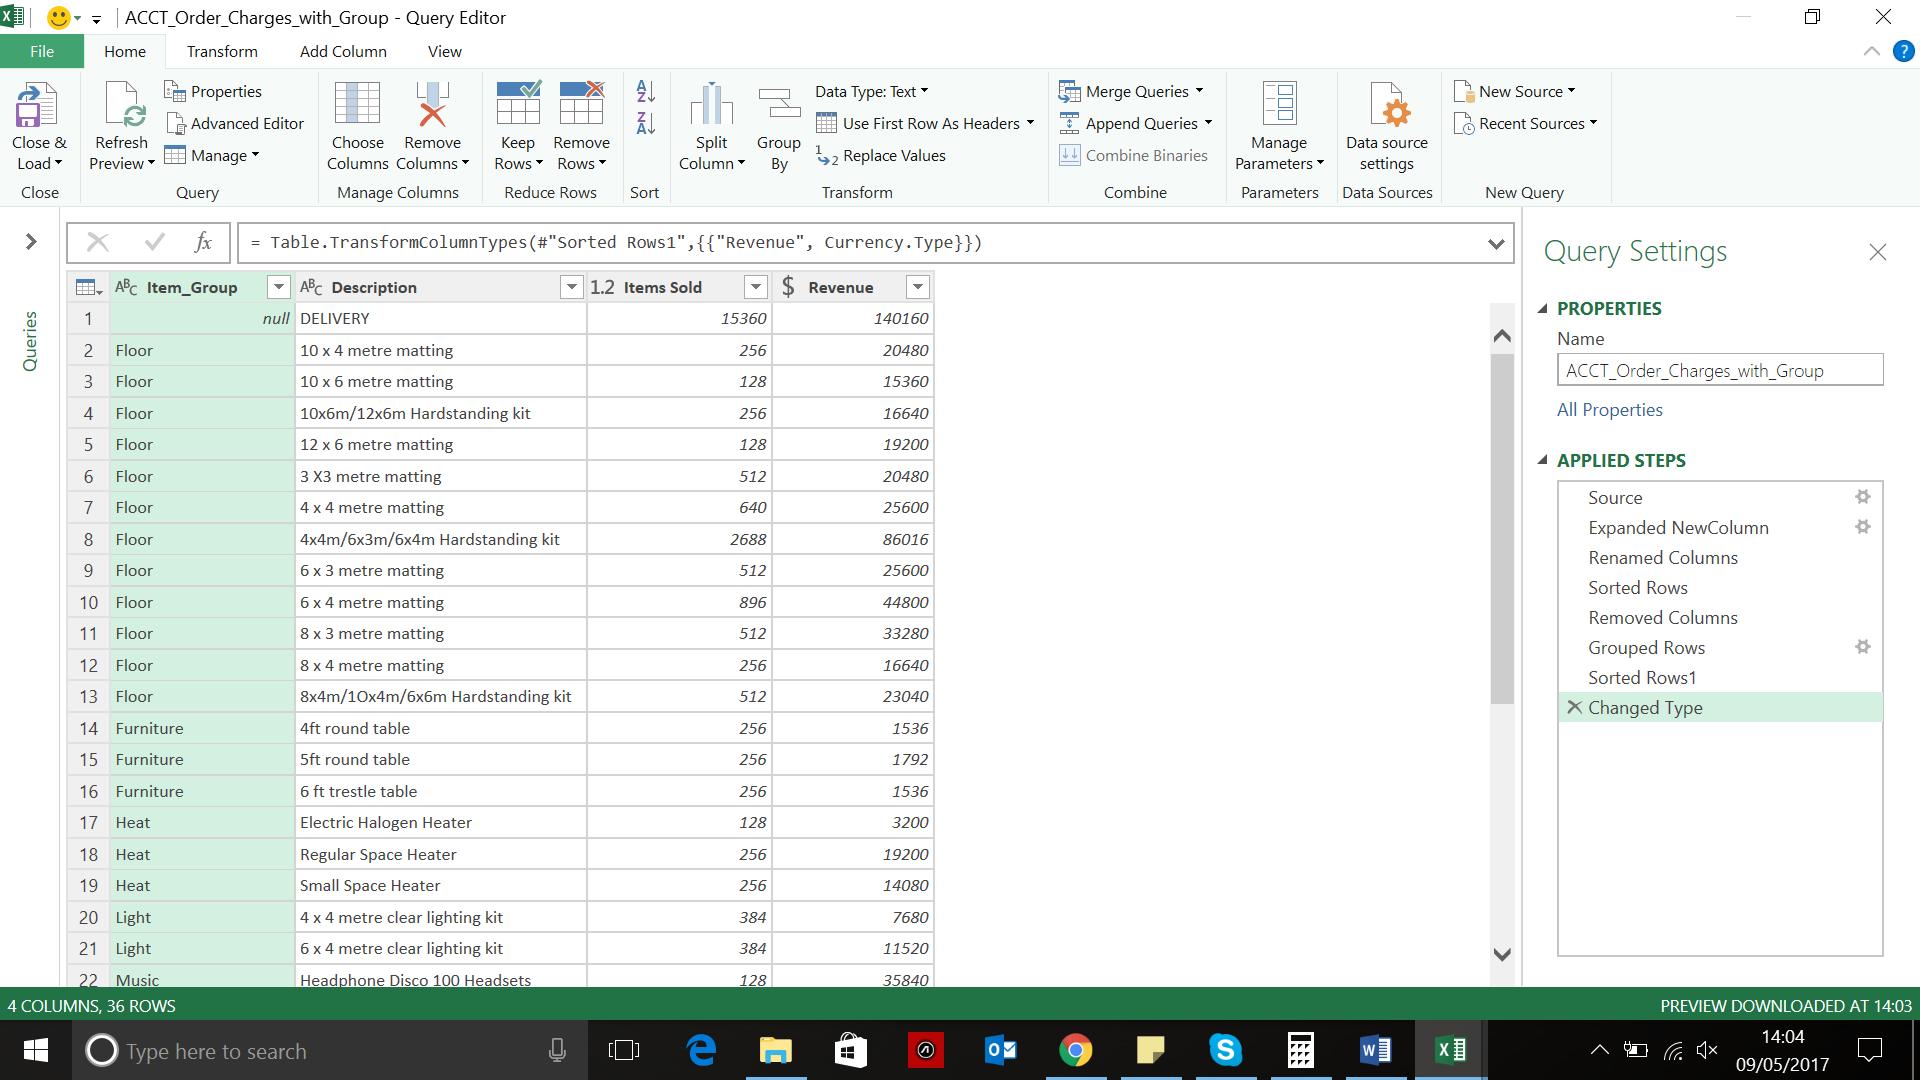
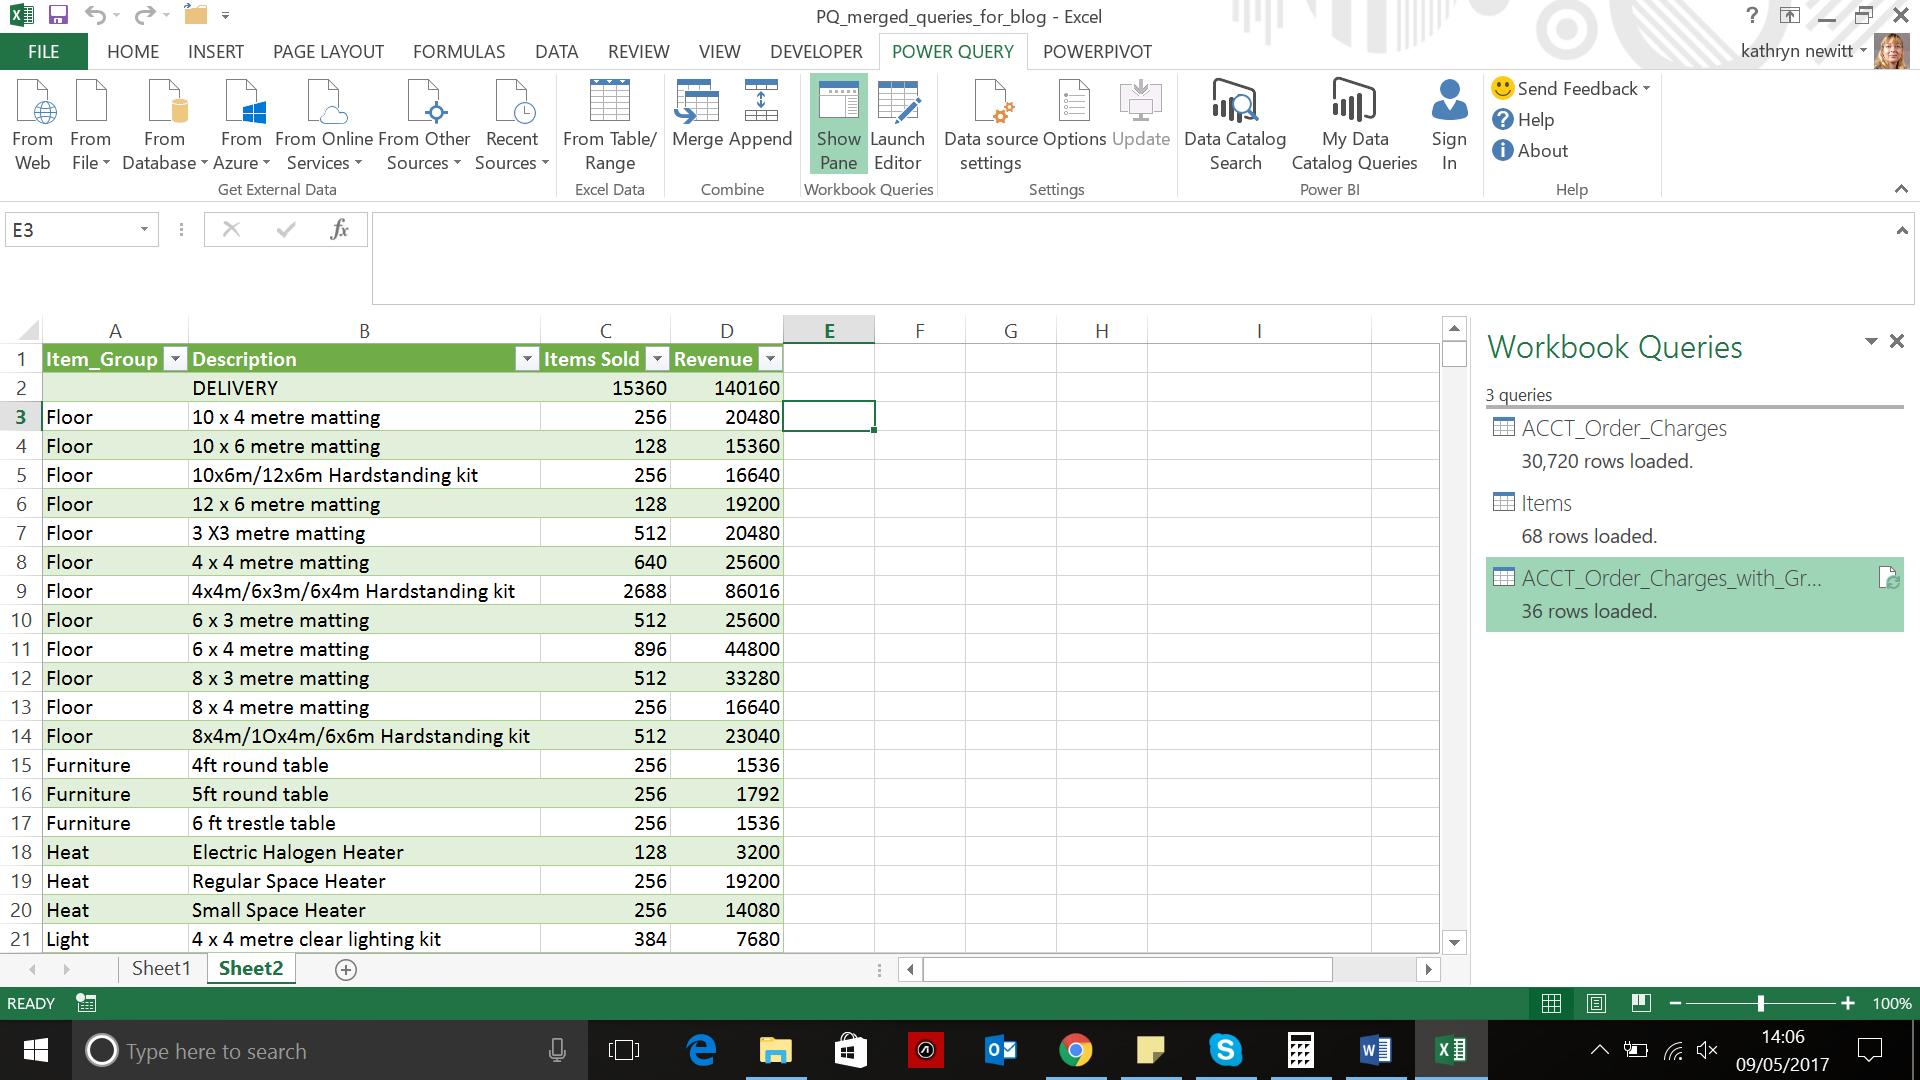
My data is now ready to load. Since it is grouped there are now less rows to upload, which illustrates how grouping in Power Query assists any work done in Excel.
Next time I’ll take a look at summarising in Power Query…
Want to read more about Power Query? A complete list of all our Power Query blogs can be found here. Come back next time for more ways to use Power Query!