
Power BI Blog: Text isn't Limiting! - Part 4
29 March 2018
Welcome back to Power BI Tips!
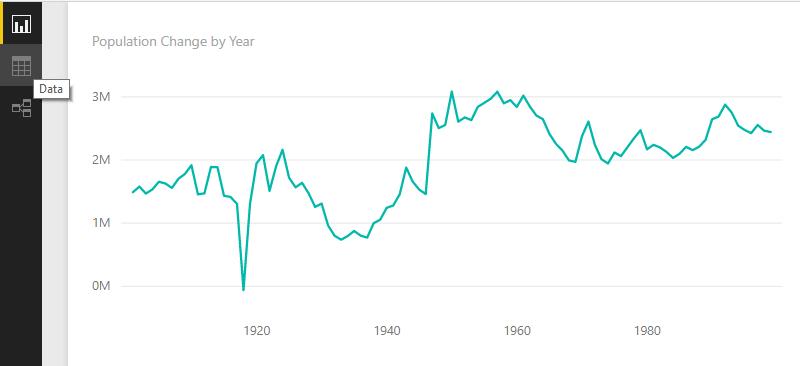
Last week using the US Historical Population Estimates, we started with a simple line chart visualisation showing the population change over the 20th century. But what if we wanted to focus on a specific decade? We would have to calculate the decade and then use an appropriate tool to focus.
This week, we’re going to explore how we can compute the calculations using DAX.
We've done a lot of work in the Query Editor for data manipulation which uses M. However now that we are happy with the output, it's time to play with data and do some analysis.
In Power BI, calculations can be done using DAX. DAX stands for Data Analysis eXpressions and is the language that drives Power Pivot. Power BI nicely combines Power Query and Power Pivot from Excel to easily transition the analyst from tedious spreadsheet work over to the wild world of data play.
Back to our report workspace, let’s have a look at the resulting query tables by clicking on the “Data” icon on the left hand side.
It displays the data in table format:
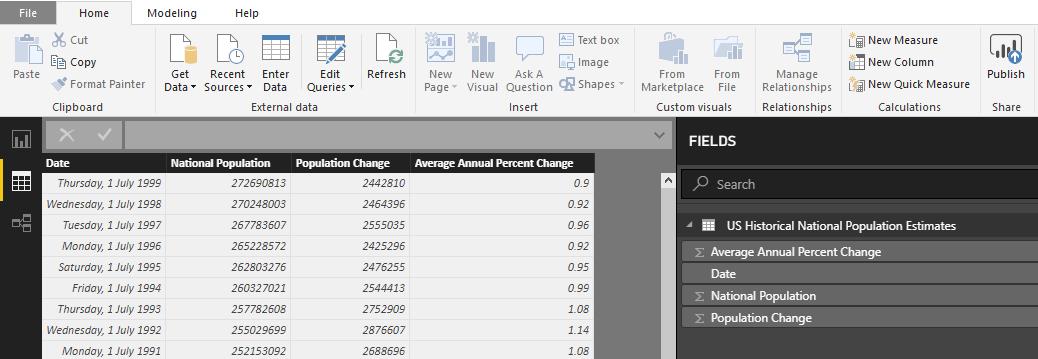
Note that this will only display one table at a time. The table that will be displayed will be the one selected from the Fields pane on the far right.
It is in this area where we can start creating columns and measures identical to Power Pivot.
In order to calculate the decade, we will need the year of our statistics. There’s a couple of ways to extract the year using DAX.
Method 1: Using the DAX function YEAR
The YEAR function in DAX is analogous to Excel’s YEAR function and has the syntax:
YEAR(<date>)
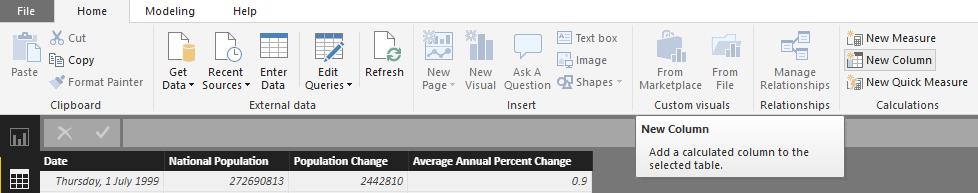
Let’s create a new column. On the ribbon in the Home tab under the Calculations category select New Column:
The formula bar will activate and initially have a highlighted “Column = “ and a new column will appear in the table with the heading “Column”:
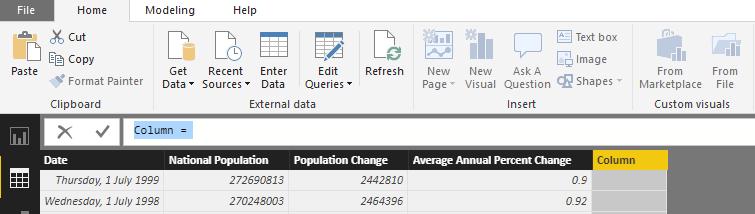
We can immediately start typing the formula directly in. The left-hand side before the equals operator is what we would like to be the header of the column. I’m going to use “Year” as the column name and use the DAX function above to calculate the year.
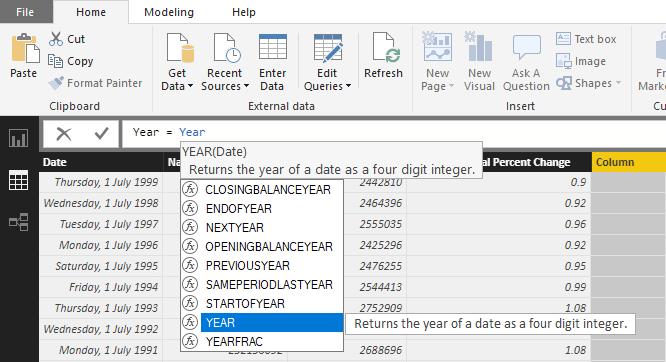
When things are typed in the formula bar, it brings up a list available functions like Excel. Unlike earlier versions of Excel though, it shows all formulae that contain the text, not just the ones that start with what was typed.
Another point of difference from Excel is that, clicking on the column to select it as a parameter will not work - it must be typed in.
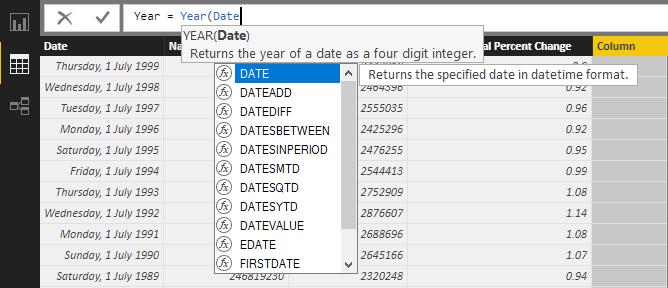
If we type “Date”, the name of the column, there are too many DAX formulae that contain DATE to autocomplete with our column name.
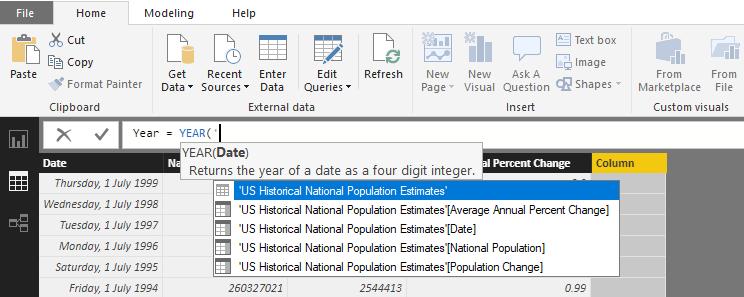
Again, similar to how it is done in Excel (and also M in Power Query), DAX uses a similar style of structured referencing for tables. Unlike Excel, since Queries and Tables can have spaces in the name, they use an ‘ (apostrophe) to indicate the name of the table and square brackets to indicate the column. In this case, our column using the structured referencing would be:
‘US Historical National Population Estimates’[Date]
To bring up the table, we just need to start typing ‘:
Alternatively, we could simply type a square bracket [ which will bring up all the columns in the current table:
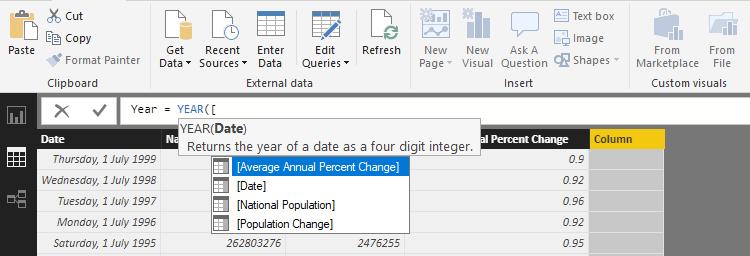
Note this doesn’t reference the table name. Best practice is to also reference the table name, especially if you have multiple tables that have the same column header.
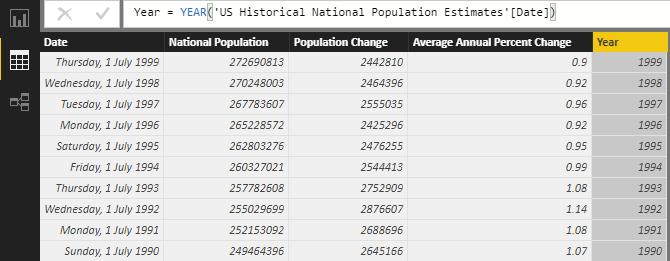
Final formula:
Year = YEAR('US Historical National Population Estimates'[Date])
Method 2: Referencing the Year property of the datetime data type
When referencing datetime or date datatypes, there is an option to select certain properties of the date it refers to. After selecting the date column, a list will pop up:
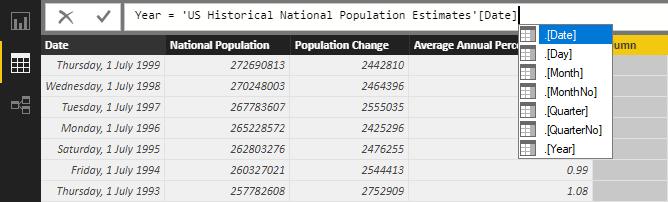
By selecting the .[Year] property, this will give identical results to using the DAX function of YEAR.
Final formula:
Year = 'US Historical National Population Estimates'[Date].[Year]
Calculating the decade
This will accurately be stored as a whole number, however we do not need to convert the number to use it in text functions, unlike Power Query. We’re going to take the first 3 numbers of the year as the decade and append “0s” to the end. The DAX function to retrieve a specified number of characters from the beginning of a string is the LEFT using the syntax:
LEFT(<text>, <num_chars>)
Note that his is identical to the Excel function.
DAX and M also use the ‘&’ operator to concatenate text. So to create the Decade column I’m going to use the formula:
Decade = LEFT('US Historical National Population Estimates'[Year],3)&"0s"
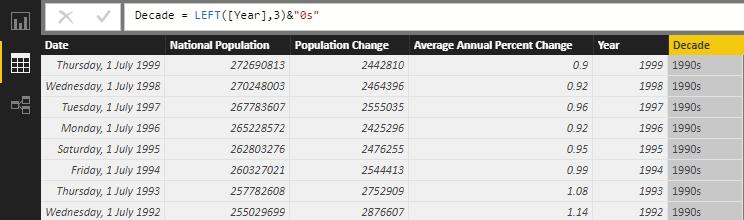
Fabulous! Now we can use the Decade column to filter out our data. We will demonstrate how to do that using the 'Slicer' visualisation next time.
If you want to do some more advanced applications of DAX please refer to our Power Pivot Principles blog released every Tuesday.
For more on M, please refer to our Power Query blog series released every Wednesday.
Tune in next week for more Power BI Tips!