
Power BI Blog: Access-ible Data - Part 3
26 July 2018
Welcome back to Power BI Tips!
Last time before our break we imported a selection of tables from the IPEDS survey and so now it is time to see what Power BI has done with it!
Let’s go to the “Relationships” tab which is the last tab on the left-hand navigation panel:
This is what you’ll see:
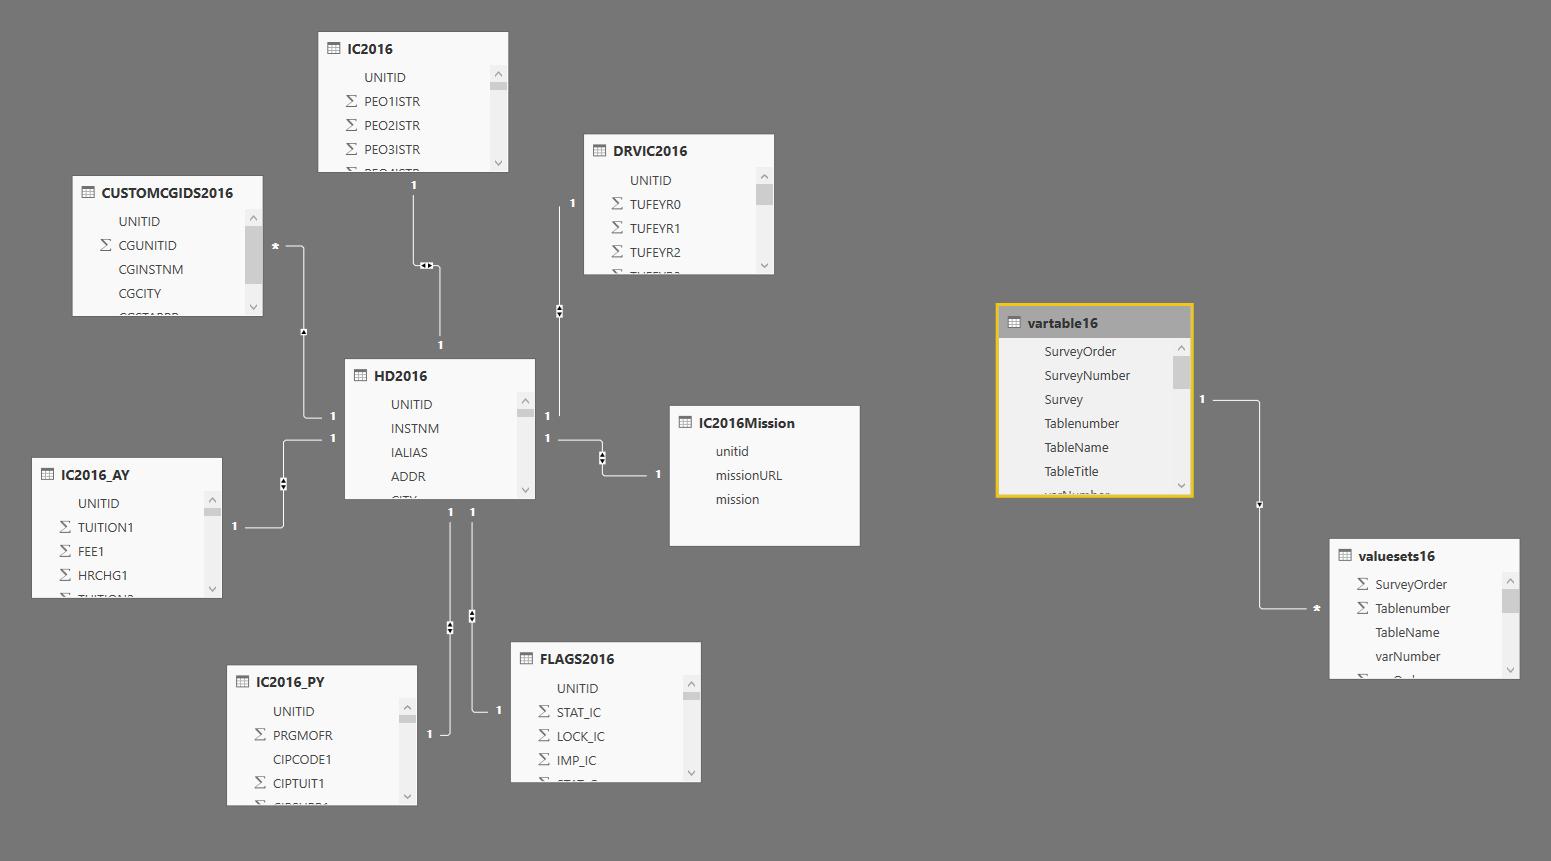
This is a simplified database schema – a pictorial representation of our database and how the tables are related to each other.
You can see that Power BI has made a best estimate at the relationships between the tables and joined the table with some lines with information that describes it.
Click on a line, you will be able to see the relationship in greater detail. I’ve resized the boxes that represent in the table in mine to illustrate it better.
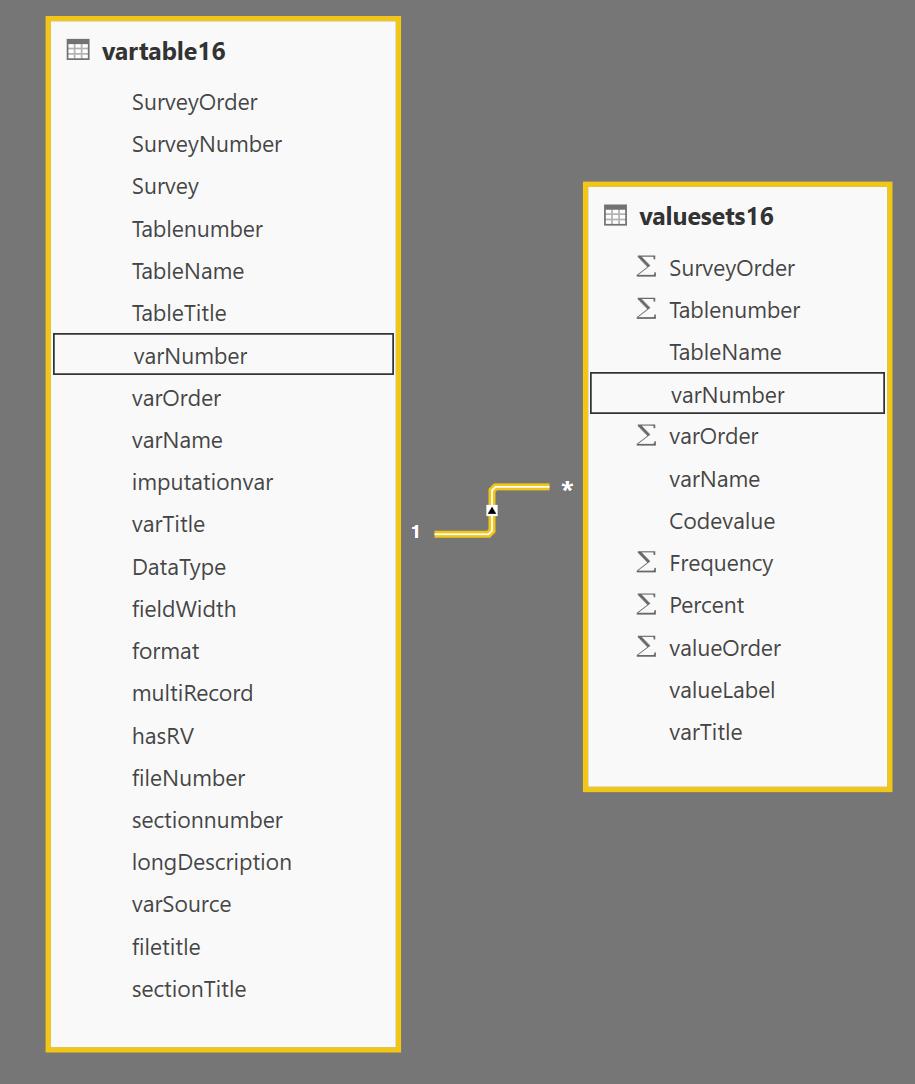
You’ll notice that the field varNumber has been highlighted in both. This line says that there is a relationship between the two tables on that field.
The ends of the lines have a 1 or a *. * in this case represents many. Vartable16 and valuesest16 have a one to many relationship. This means that there is one value in vartable16[varNumber] that relates to many in valuesets16[varNumber]. The arrow indicates the direction of the relationship.
In our depicted scheme we can see that all the other tables fan a star around table HD2016. The description for this table is: “This table contains directory information for every institution in the 2016 IPEDS universe.” This makes sense that as HD2016 is essentially the master table of the institutions, that it links all the survey components together.
One of the nice things about Power BI is that unlike an Access databases, we can have longer, more descriptive column names that contain spaces. Next time, we’re going to transform our tables into something more readable that would be easier to access and analyse – and examine how our relationships therefore change as a result.
Tune in next week for more Power BI Tips!